When Apple’s stock price rose in early 2025, it briefly became the first company to exceed a $3.5 trillion market value. That figure did not appear on any product label or earnings report. Market capitalization — the total market value of all a company’s outstanding shares — calculated it automatically from price and share count alone. Understanding market capitalization helps investors compare company sizes, assess risk levels, and build portfolios that match their own financial goals. Market cap, short for market capitalization, measures a company’s value in dollar terms, calculated by multiplying the total number of shares of a company’s stock by the current market price of that stock. That multiplication happens in real time, every second the market is open. Chase
What Is Market Capitalization and How to Calculate It
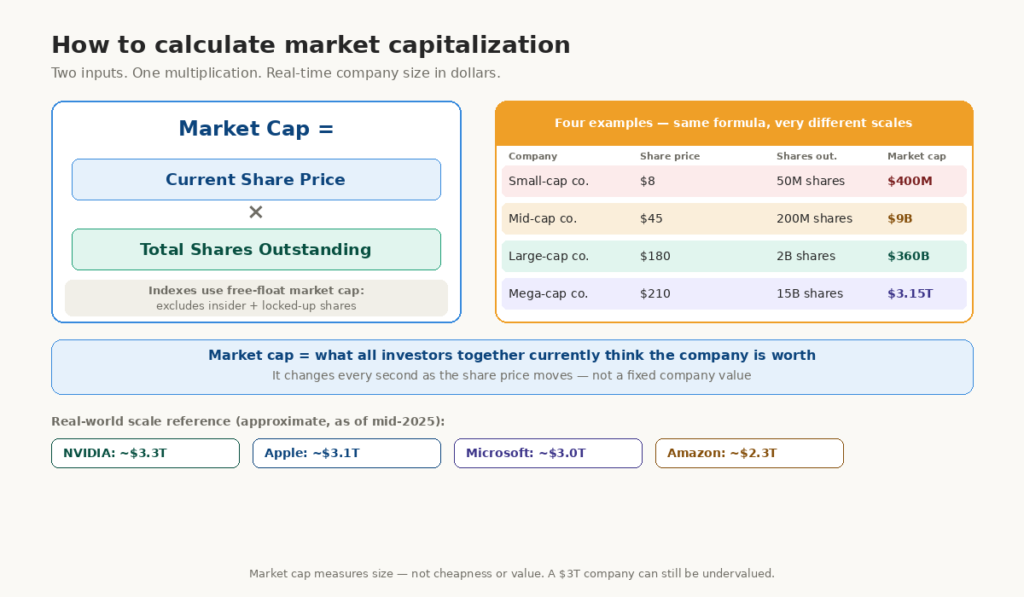
The market capitalization formula has only two inputs. Multiply the current share price by the total number of shares outstanding. Specifically, shares outstanding means all shares currently held by investors — including institutional holders, insiders, and the public. For example, a company with 100 million shares of stock at a market price of $20 per share would have a market cap of $2 billion. Chase
Together, these produce two critical insights: how large the company is, and how much capital investors have collectively allocated to it. Both inputs change constantly. The share price moves with every trade during market hours. Shares outstanding changes less frequently, typically when a company issues new shares, buys back existing shares, or completes a stock split.
| Example | Share price | Shares outstanding | Market cap |
|---|---|---|---|
| Small company | $8.00 | 50 million | $400 million |
| Mid-size company | $45.00 | 200 million | $9 billion |
| Large company | $180.00 | 2 billion | $360 billion |
| Mega-cap company | $210.00 | 15 billion | $3.15 trillion |
Market cap considers all of a company’s outstanding shares and is a common measure used to describe a company’s size. Free-float market cap considers only shares freely available for trading in the market and is a common measure used in index weightings — it subtracts shares held by officers, directors, and other entities unlikely to trade. Most index calculations, including the S&P 500, use free-float market cap to weight their components. Fidelity
You can review the SEC’s investor resources on publicly traded companies for official context on how share counts and market values appear in company filings.
Market Cap Categories: Mega, Large, Mid, Small, and Micro
The Five Market Cap Tiers
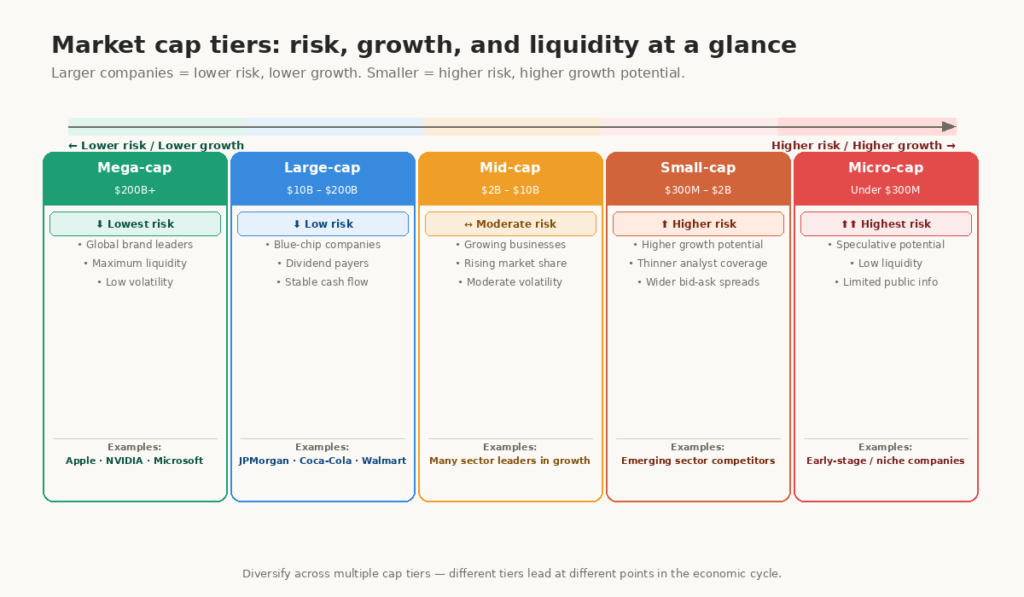
Investors group stocks into size categories because size strongly correlates with risk, growth potential, liquidity, and analyst coverage. Market cap is broken down into five segments: mega, large, mid, small, and micro. Mega-cap stocks will likely be less risky than micro-cap stocks as they are larger, have greater liquidity, and are less susceptible to market manipulation. Chase
| Tier | Market cap range | Characteristics | Example companies |
|---|---|---|---|
| Mega-cap | $200B+ | Global brand dominance, maximum liquidity | Apple, Microsoft, NVIDIA |
| Large-cap | $10B–$200B | Established leaders, dividend payers | JPMorgan Chase, Coca-Cola |
| Mid-cap | $2B–$10B | Growing companies, moderate risk | Many sector leaders in growth phase |
| Small-cap | $300M–$2B | Higher growth potential, lower liquidity | Emerging sector competitors |
| Micro-cap | Under $300M | Speculative, limited analyst coverage | Early-stage or niche companies |
However, these ranges are not universal. Different index providers and financial institutions define the thresholds slightly differently. However, the relative risk-reward profile of each tier remains consistent across the industry.
Large-Cap Stocks
Large-cap companies generally have a market cap of $10 billion or more. These are often well-established companies that may pose less risk and volatility than smaller peers. However, when companies become large their growth rates can slow, so they might also offer less growth potential than some smaller companies. Fidelity
Blue-chip status often accompanies large-cap classification. These household-name businesses typically dominate established industries, generate consistent cash flow, and maintain long track records of dividend payments. Even so, large-cap status does not guarantee safety — Enron and General Motors both held large-cap standing before significant declines. Large-cap stocks known as blue chips often have a reputation for producing quality goods and services, and a history of consistent dividend payments and steady growth. Large-cap companies are often dominant players within established industries, and their brand names may be familiar to a national consumer audience. Fidelity
Large-cap companies generally have a market cap of $10 billion or more. As a group, they may pose less risk and volatility to investors than smaller companies. However, when companies become large their growth rates can slow, so they might also offer less growth potential than some smaller companies. Fidelity
Mid-Cap and Small-Cap Stocks
Mid-cap stocks are typically issued by established companies in industries experiencing or expected to experience rapid growth. These medium-sized companies may be in the process of increasing market share and improving overall competitiveness. Mid caps may offer more growth potential than large caps, and possibly less risk than small caps. Fidelity
Small-cap companies carry higher potential returns alongside meaningfully higher risk. Lower average daily trading volume creates wider bid-ask spreads, making entry and exit more expensive. Analyst coverage tends to be thinner, which means less public information exists to inform investment decisions. Furthermore, small-cap companies face greater vulnerability during economic downturns because they typically carry less financial cushion than their larger peers.
How Market Cap Affects Index Membership and Institutional Interest
Index Inclusion and Weighting
Market cap determines which indexes a stock belongs to and how much weight it carries within those indexes. The S&P 500 requires companies to have a market cap above a regularly reviewed minimum threshold — as of mid-2025, the requirement exceeded $18 billion. Companies falling below this threshold risk removal from the index.
Furthermore, index membership matters enormously for institutional investment flows. Hundreds of ETFs and index funds tracking the S&P 500 must hold every component in proportion to its market cap weight. When a stock enters the S&P 500, those funds collectively buy millions of shares automatically. Institutional demand of this scale can meaningfully affect a stock’s price and liquidity. This mechanical buying pressure is one reason why S&P 500 inclusion often coincides with short-term price appreciation.
Smart Money and Market Cap Signals
Experienced investors track market cap changes over time as one signal of business momentum. A company that grows from small-cap to mid-cap while maintaining strong earnings and expanding margins demonstrates compounding business quality. Disciplined investors sometimes focus on this “cap migration” pattern — identifying companies early in their growth trajectory before they cross into the next size tier and attract broader institutional ownership.
However, market cap alone does not indicate whether a stock is cheap or expensive. A $500 billion company can be dramatically undervalued while a $300 million company can be severely overpriced. Market cap measures size, not value. Combining market cap with valuation metrics like the P/E ratio, price-to-sales, and free cash flow yield produces a more complete picture. Our guide on what is the P/E ratio explains how to combine these metrics effectively.
What Market Cap Tells Investors About Risk and Portfolio Construction
Risk-Reward Differences Across Cap Tiers
Market cap provides investors with a practical proxy for risk before they study any financial statement. A conservative investor looking for stability might allocate a greater portion of funds to large- and mega-cap stocks, which may mitigate portfolio risk but dampen growth prospects. An investor who wants to focus on growing the portfolio might allocate more to small- and micro-cap stocks. While the potential for reward is higher, so too is the risk level. Chase
This risk-return relationship connects directly to investor psychology. Recency bias leads many investors to chase small-cap stocks after a period of strong small-cap performance, forgetting that higher growth potential comes with deeper potential drawdowns. Loss aversion then prevents these investors from cutting losses when small-cap positions decline sharply, because the original growth story still feels compelling. Structuring a portfolio with deliberate allocations across multiple cap tiers reduces both of these behavioral risks.
Diversifying Across Market Cap Tiers
When evaluating investment opportunities, you might consider diversifying among large-cap, mid-cap, and small-cap companies. That is because there might be times when one of these groups performs well but another does not. During periods of economic expansion, small-cap and mid-cap stocks often lead market performance as growth accelerates across the economy. During recessions or periods of market stress, large-cap and mega-cap stocks tend to hold value better because of their stronger balance sheets, global revenue diversification, and consistent cash flow generation. Fidelity
Common Beginner Mistakes With Market Cap
Many beginners equate a low share price with a small company. A stock trading at $3 per share might belong to a company with 5 billion shares outstanding — giving it a $15 billion market cap that classifies it firmly as large-cap. Share price alone reveals nothing about company size. Market cap is the correct measure of scale.
In addition, another common error involves ignoring market cap when assessing diversification. An investor who owns ten different technology companies, all large-cap or mega-cap, holds a much less diversified portfolio than one spread across multiple cap tiers and sectors. True diversification requires deliberate attention to both sector and market cap distribution.
For further reading, explore these related guides:
How does market capitalization change over time?
Market cap changes constantly because it depends on the current share price, which moves with every trade during market hours. A company reporting strong earnings, launching a successful product, or benefiting from a sector tailwind will typically see its share price rise — and its market cap increase proportionally. Conversely, disappointing earnings, regulatory problems, or broader market selloffs reduce market cap. Over years, a company that consistently grows earnings tends to see its market cap expand, sometimes crossing from one size tier into the next.
Why do large-cap stocks generally carry less risk than small-cap stocks?
Large-cap companies typically carry less risk for several interconnected reasons. First, their size gives them financial resources to weather economic downturns that would threaten smaller competitors. Second, higher average daily trading volume means investors can buy and sell large positions without significantly moving the price. Third, extensive analyst coverage produces more public information, reducing information risk. Fourth, large-cap companies often generate consistent cash flow and pay dividends, providing returns even when share prices decline temporarily. None of these factors eliminates risk entirely — even large companies can fail — but they collectively reduce the likelihood of severe permanent loss.
Can a company’s market cap tier change?
Yes, companies move between market cap tiers regularly as their share prices and share counts evolve. Amazon, NVIDIA, and Apple all spent years in mid-cap and large-cap territory before growing into mega-cap status. The opposite also happens — companies that lose competitive position, report persistent losses, or face industry disruption can decline from large-cap to mid-cap or even small-cap status. Index providers review component eligibility periodically and remove companies that no longer meet the criteria for a particular tier, which itself can trigger selling pressure as index funds rebalance.