Watch any stock on a busy earnings morning and you will notice the volume bar at the bottom of the chart exploding upward before the price even moves significantly. That bar is not decoration. Understanding what is trading volume means understanding whether a price move has real participation behind it or whether it is a thin, unreliable signal. Volume measures the amount that a financial asset changes hands during a given period of time. For stocks, volume is based on the number of shares traded. Each transaction between a buyer and a seller adds to the security’s volume count. A single share changing hands once counts as one unit of volume. One hundred million shares changing hands in a single session signals something entirely different. Chase
What Is Trading Volume and How Is It Measured
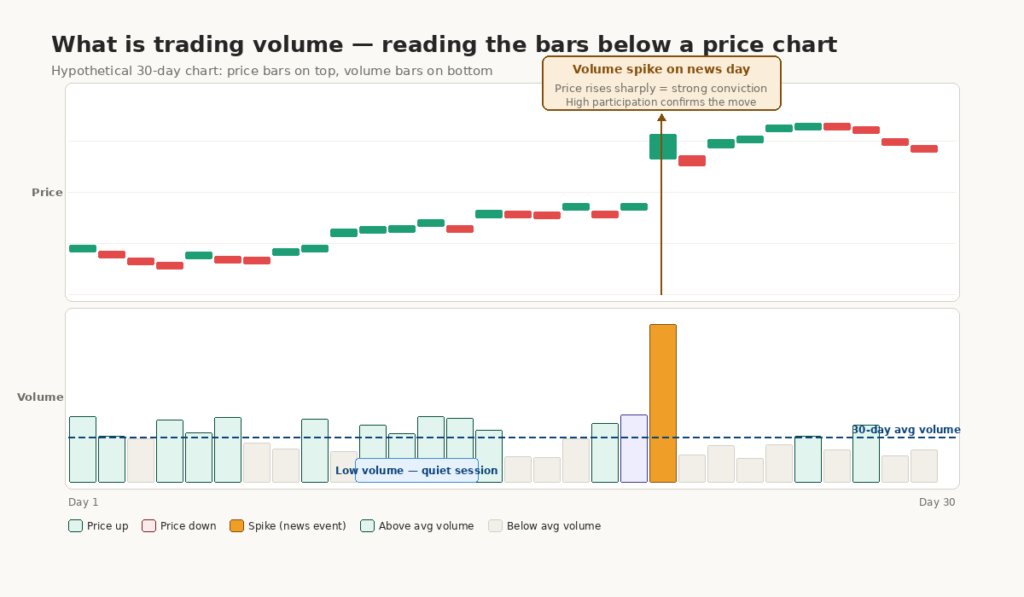
Trading volume counts the total number of shares bought and sold during a specific period — most commonly one trading day. Every completed transaction between a buyer and a seller contributes exactly one unit to the day’s volume count, regardless of price. In simple terms, volume shows how active the market is. If 1 million shares of a stock change hands in one day, that stock’s daily trading volume is 1 million. Volume is usually displayed as bars below a price chart, with each bar representing volume for that time period. Gotrade
Volume data appears on every brokerage platform and financial website. The number shown in a stock quote reflects cumulative shares traded since the market opened at 9:30 a.m. Eastern Time. Most platforms also display the 30-day or 90-day average daily volume alongside today’s figure. That average becomes your baseline — the reference point that makes today’s number meaningful.
| Volume term | Definition | Where to find it |
|---|---|---|
| Daily volume | Total shares traded today | Any stock quote page |
| Average daily volume (ADV) | Mean daily volume over 30–90 days | Stock quote, brokerage platform |
| Relative volume | Today’s volume ÷ ADV | Brokerage screeners, chart tools |
| Volume spike | Volume significantly above ADV | Visible on chart as tall bar |
The NYSE reported an average daily trading volume of approximately 1.54 billion shares valued at around $80.6 billion in mid-November 2025, reflecting the scale and liquidity of the U.S. equity market. Individual stocks within that market range from trading millions of shares daily to trading just a few thousand — and that difference shapes everything from execution quality to price reliability. Best Brokers
You can review the SEC’s investor resources on how markets operate for official context on trading mechanics and volume reporting.
Volume and Price: What the Combination Signals
Rising Price on High Volume
The most important thing volume reveals is whether a price move has real conviction behind it. When a stock is rising and volume is increasing, it indicates strength. Investors can assess how convicted traders are about a particular stock or the market in general. High volumes indicate strong conviction in the direction in which the stock or market is moving. A stock climbing 3% on twice its average daily volume draws institutional participation. The same 3% gain on half its average volume may reflect a handful of smaller orders with limited significance. Seeking Alpha
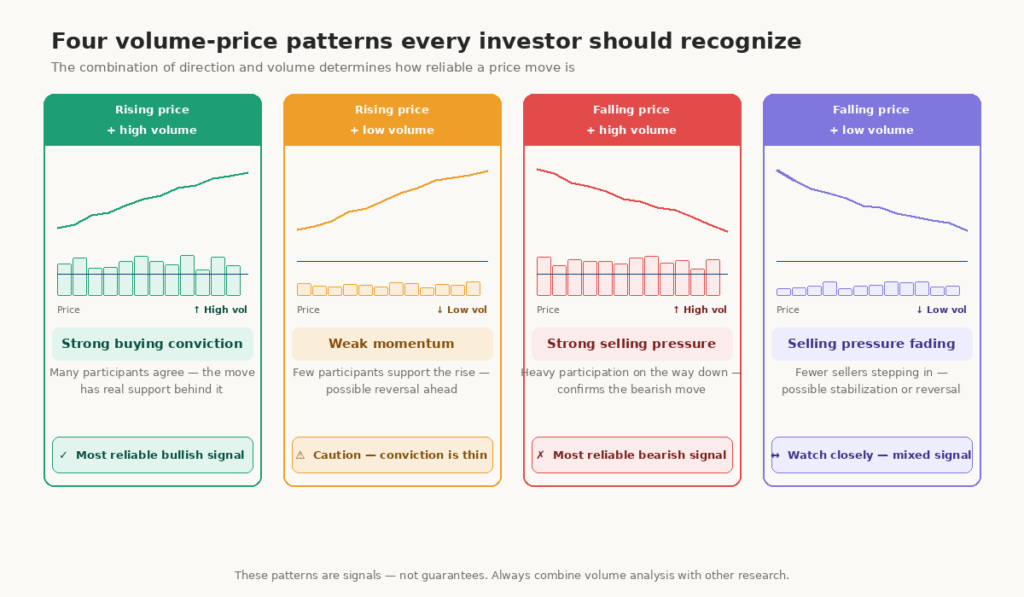
Four core volume-price combinations help investors read market sentiment:
| Price direction | Volume level | What it may suggest | Reliability |
|---|---|---|---|
| Rising | High | Strong buying conviction | High |
| Rising | Low | Weak momentum, possible fade | Lower |
| Falling | High | Strong selling pressure | High |
| Falling | Low | Selling pressure fading, possible stabilization | Moderate |
These patterns do not guarantee future price direction. However, disciplined investors use them as context before making decisions rather than acting on price alone.
Declining Price on Low Volume
A stock that falls 2% on volume well below its average may simply reflect light selling during a quiet session. The same decline on heavy volume signals broader investor exit — potentially more meaningful and sustained. If investors see a rising price and declining volume, it might suggest a lack of interest, and a reversal may be just around the corner. In such a scenario, it might not be a good idea to buy that particular stock. Seeking Alpha
Volume Spikes and What Causes Them
Sudden, dramatic volume increases on a normally quiet stock attract immediate attention from experienced investors. Earnings releases, merger announcements, FDA decisions, and macroeconomic data releases all trigger volume spikes. When a stock has an unusually high volume, it often means something important is going on with the company, be it related directly to company developments or simply a rumor. The key question is always whether the news justifies the price move, not just whether volume is high. Seeking Alpha
Our guide on how to read a stock quote explains exactly where to find the volume figure and average daily volume on any standard quote page.
Why Average Daily Volume Matters to Every Investor
Liquidity and Execution Quality
Average daily volume directly determines a stock’s liquidity. Liquidity means how quickly and easily you can buy or sell shares without significantly moving the price. Securities with high daily volume are generally more liquid than those with low daily volume. A stock trading 30 million shares per day absorbs your order invisibly. A stock trading 50,000 shares per day may move noticeably when you place even a modest order. Chase
Low liquidity creates practical problems for investors. Wide bid-ask spreads increase your entry and exit costs. Large orders cannot fill instantly and may require multiple partial executions at different prices — a problem called slippage. Furthermore, during market stress, thinly traded stocks can become temporarily impossible to sell at any reasonable price. Choosing stocks with adequate average daily volume eliminates most of these execution risks before they occur.
Volume During Market Hours
Volume does not distribute evenly throughout the trading day. In general, volume is highest right after the market opens and right before it closes. Volume also tends to be higher on Mondays and Fridays and lower midweek. Additionally, volume usually slows down around lunchtime and before holidays. This intraday pattern means that price moves in the first and last 30 minutes of the session often carry more weight than identical-sized moves during the midday lull. Chase
Experienced investors account for this pattern when they evaluate volume signals. A price breakout on elevated volume at 10:00 a.m. carries more weight than the same breakout at 12:30 p.m. when participation naturally thins out.
Smart Money and Institutional Volume Footprints
How Institutions Leave Volume Signals
Large institutional investors — mutual funds, pension funds, and hedge funds — cannot hide their activity entirely. When an institution buys or sells millions of shares, volume rises above its average. Smart money flow analysis uses this principle to identify possible institutional accumulation or distribution before price fully reflects the activity.
A stock that holds its price steady or advances modestly while volume gradually expands over several weeks may indicate institutional accumulation. Accumulation means buyers are patiently acquiring shares without driving the price up sharply. Disciplined investors watch for this pattern as one possible signal of future price strength, though it does not guarantee returns. The FINRA investor resources explain how market participants report and disclose large trading activity.
Common Beginner Mistakes With Volume
Many beginners ignore volume entirely and focus only on price percentage changes. This leads to buying stocks making large percentage moves on extremely low volume — moves that frequently reverse quickly because few participants supported them. Another mistake involves treating any high-volume day as automatically bullish. High volume on a sharp price decline is bearish confirmation, not a buying signal. Furthermore, some investors compare volume across different stocks without adjusting for market cap or float. A 10-million-share day means something very different for a stock with 500 million shares outstanding versus one with 20 million.
For further reading, explore these related guides:
What counts as high trading volume for a stock?
High volume is always relative to the stock’s own average daily volume — not an absolute number. A large-cap stock like Apple trading 60 million shares in a day may be considered normal activity. A small-cap stock trading 500,000 shares when its 30-day average is 80,000 represents extremely high relative volume. Most brokerage platforms display relative volume as a ratio, such as 2.5x, meaning today’s volume runs at 2.5 times the recent average. Readings above 1.5x typically attract attention from disciplined investors using volume analysis.
Does high volume always mean a stock will go up?
High volume confirms participation but does not determine direction. Heavy volume accompanies both strong advances and sharp declines. The direction of the price move matters equally. Rising price on high volume suggests strong buying conviction. Falling price on high volume suggests strong selling pressure. Volume is a confirmation tool — it helps assess whether a price move deserves attention, not which direction the price will go next. Past volume patterns never guarantee future price performance.
Should long-term investors pay attention to trading volume?
Long-term investors benefit from volume awareness even if they rarely trade. First, checking average daily volume before buying ensures you choose a liquid stock you can exit easily when needed. Second, unusual volume spikes sometimes signal company-specific news worth researching before it reaches mainstream headlines. Third, stocks with consistently growing average daily volume over months may reflect rising institutional interest — a factor worth noting as part of broader fundamental research. However, long-term investors should not trade based solely on short-term volume signals.