Pull up any stock on Google Finance or Yahoo Finance and you will see a page filled with numbers, percentages, and abbreviations. Most beginners ignore everything except the current price. That single habit costs money. Learning how to read a stock quote correctly means understanding what each field measures, why it matters, and what it reveals about the business behind the ticker. A stock quote is a real-time snapshot of a publicly traded company’s market data. Knowing how to read a stock quote starts with the fields that appear on every platform. Each number answers a specific question a disciplined investor should ask before buying any share.
How to Read a Stock Quote: The Essential Fields
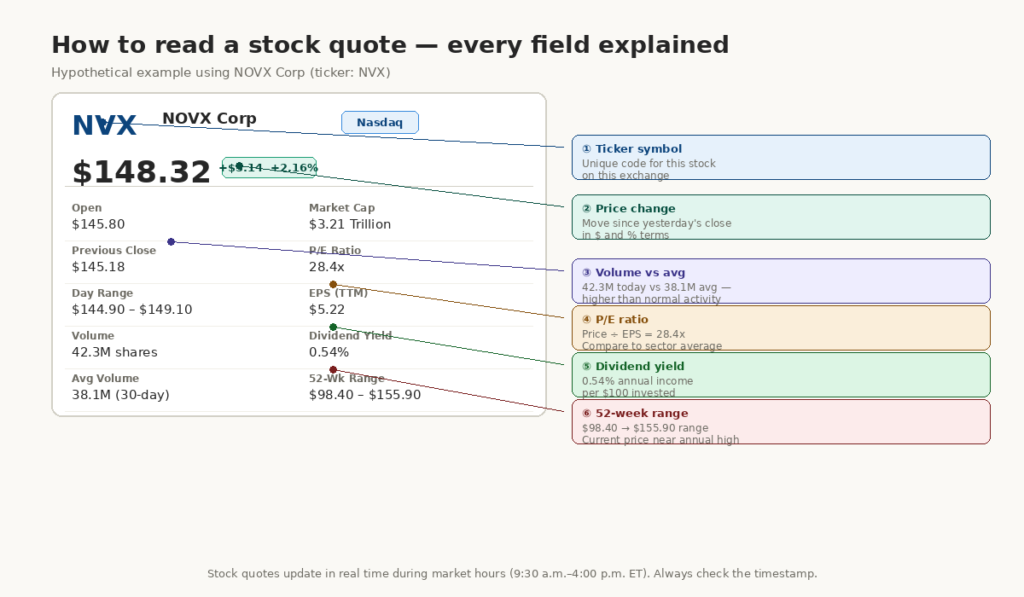
Every stock quote begins with two identifiers. The company name tells you which business you are looking at. The ticker symbol is a short alphabetical code that uniquely identifies that company on a specific exchange. Apple trades as AAPL on Nasdaq. Microsoft trades as MSFT on the same exchange. Ticker symbols exist because exchange systems process thousands of orders per second and full company names are too slow to work with.
Below the name and ticker, you will see the current price alongside two critical companion numbers. The change shows how many dollars the price has moved since yesterday’s closing price. The percentage change translates that move into a ratio. A $4.00 gain on a $200 stock equals a 2.0% change — which matters more than the raw dollar amount when comparing stocks at different price levels.
| Quote field | What it measures | Why it matters |
|---|---|---|
| Ticker symbol | Unique exchange identifier | Confirms you are viewing the right company |
| Last price | Most recent trade price | Starting point for all decisions |
| Change / % change | Move since yesterday’s close | Shows daily momentum direction |
| Open | First trade price of the day | Reveals overnight sentiment shift |
| Previous close | Yesterday’s final price | Baseline for today’s change calculation |
| Volume | Shares traded today | Measures conviction behind the move |
The open price deserves attention because stocks rarely open at the same price they closed the previous day. News released after hours — earnings reports, economic data, or geopolitical events — shifts the price before the market opens. The last traded price, daily trading range, and volume are among the most important pieces of information a stock quote shows. StockTrak
You can review the SEC’s introduction to stocks and reading market data for additional official context on how quotes are structured and reported.
Price Context: Volume, 52-Week Range, and Market Cap
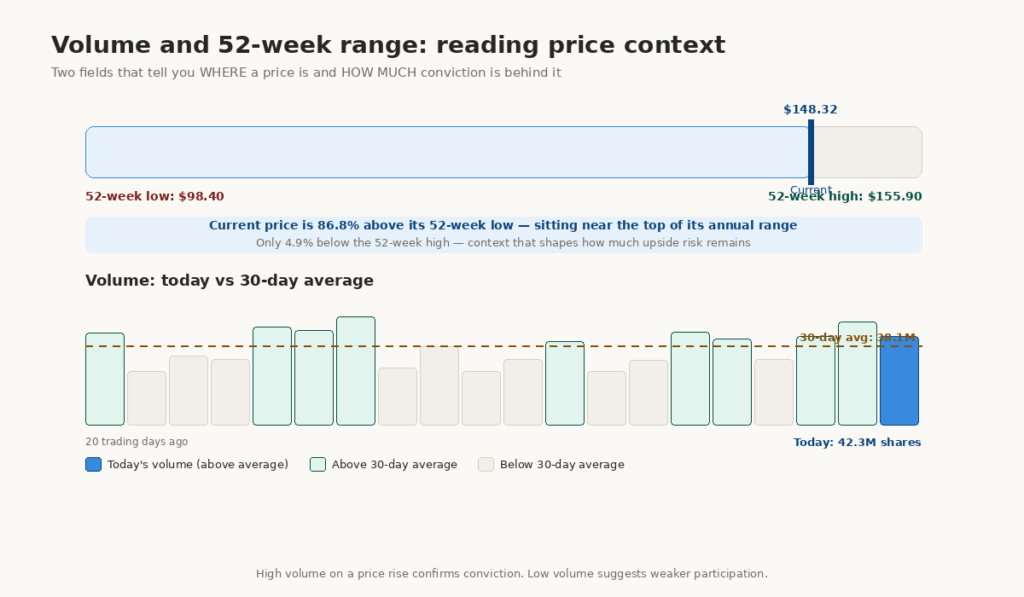
Trading volume measures how many shares have changed hands during the current trading session. High volume on a price move confirms that many investors participated in that move. Low volume on a price move suggests fewer participants and less conviction. Volume refers to the number of shares that have been traded during the day. Higher volume means that more trades have occurred, and lower volume indicates less frequent trading activity. Yahoo Finance
The 52-Week Range in Context
The 52-week high and low show the highest and lowest prices the stock has traded at over the past year. These are the highest and lowest prices the stock has traded at in the trailing year, which can be useful to get a sense of how close the stock currently is to setting new lows or breaking new highs for the year. A stock currently trading at $148 with a 52-week high of $150 and a 52-week low of $90 sits near its annual high after a substantial recovery. This context shapes how you interpret the current price. Medium
Market capitalization — usually shortened to market cap — is the total market value of all outstanding shares. Market cap is calculated by multiplying the current stock price by the total number of outstanding shares. A company trading at $200 per share with 10 billion shares outstanding carries a market cap of $2 trillion. Market cap matters because it determines which index a company belongs to, how much institutional ownership it attracts, and how much liquidity its shares typically carry. Yahoo Finance
A Realistic Example: Reading NVIDIA’s Quote
Consider a hypothetical NVIDIA quote showing a current price of $130, a 52-week range of $85 to $155, volume of 180 million shares, and a market cap of $3.2 trillion. The current price sits in the upper half of its annual range. Volume runs well above average for a large-cap technology stock. Together, these two data points suggest the stock attracts heavy institutional interest near its annual high — a signal worth investigating further, though past patterns never guarantee future returns.
Our guide on what is a stock explains how shares and ownership connect to the numbers you see in any quote.
Valuation and Income Fields: P/E Ratio and Dividend Yield
The price-to-earnings ratio, known as the P/E ratio, ranks among the most widely used numbers in any stock quote. Investors calculate it by dividing the current stock price by the company’s earnings per share over the past twelve months. Earnings per share, or EPS, represents the company’s total net profit divided by its total shares outstanding. A high P/E ratio could mean the stock is overpriced, while a low P/E may indicate it is undervalued. However, investors must always compare P/E ratios against the company’s sector average and historical range — never evaluate them in isolation. Finance Strategists
The next step in learning how to read a stock quote is understanding how sector context changes everything. A technology company with a P/E of 35 may be reasonably priced relative to its sector peers. A utility company with a P/E of 35 is expensive for its industry. This context requirement separates disciplined investors from beginners who treat the P/E as an absolute number.
Dividend Yield: The Income Signal on Every Quote
The dividend yield shows how much annual income a stock pays relative to its price. The dividend yield shows the amount stock owners received per share in dividends for owning the stock in the past year, expressed as a percentage of the stock price. For example, a $100 stock that paid $5 in dividends in the past year would have a 5% dividend yield. Growth-oriented technology companies that reinvest profits instead of distributing them show a blank or zero in this field. Dreamwork
Common Beginner Mistakes When Reading a Stock Quote
Many beginners focus only on the current price and ignore volume, P/E ratio, and the 52-week range entirely. This leads to buying stocks at annual highs without awareness of that context. Another common error treats a low stock price as “cheap.” A stock trading at $5 may be more expensive on a valuation basis than one trading at $500, depending on their respective earnings. Furthermore, investors sometimes confuse dividend yield with guaranteed income — a company can reduce or eliminate dividends at any time.
What Smart Investors Watch in a Stock Quote
Experienced investors use the stock quote as a starting point, not a conclusion. Volume that exceeds the 30-day average by a meaningful margin may indicate unusual institutional activity worth noting before acting. Investors who compare the current P/E against the five-year average for the same stock and its sector peers gain a clearer valuation picture. Additionally, a stock approaching its 52-week high on strong volume sometimes signals accelerating institutional accumulation. None of these signals predict future returns, but together they build a more complete picture before any capital enters the market.
Investor psychology shapes how beginners react to quote data. Recency bias causes many investors to treat a recent price rise as evidence that the price will keep rising. Herd behavior pulls capital toward stocks with the highest recent gains regardless of valuation. Awareness of these tendencies does not eliminate them, but it helps investors make calmer, more structured decisions. The investor resources at FINRA cover how to evaluate stock data and avoid common analytical mistakes.
For further reading, explore these related guides:
What is the difference between the bid price and the ask price in a stock quote?
The bid price is the highest price a buyer is currently willing to pay for a share. The ask price is the lowest price a seller is currently willing to accept. The difference between the two is the bid-ask spread. A narrow spread of one or two cents indicates a highly liquid stock with many buyers and sellers. A wider spread indicates lower liquidity, which means your order may fill at a less favorable price. Market orders fill at the best available ask when buying and the best available bid when selling.
What does it mean when a stock opens higher than it closed the previous day?
A higher open indicates that buyers were more aggressive overnight than sellers. Positive news — strong earnings, a product launch, or favorable economic data released outside regular trading hours — often drives this behavior. However, opening prices frequently reverse during the trading session as more participants react to the same news. Experienced investors often wait for the first hour of trading to settle before acting on gap openings.
How should a beginner use a stock quote to evaluate a potential investment?
Start by noting the current price within the 52-week range. Next, check the P/E ratio against the sector average. Then review volume relative to the 30-day average to identify unusual activity. After that, examine the dividend yield if income matters to your goals. Finally, confirm the market cap to understand the company’s size tier. These five steps show how to read a stock quote efficiently and avoid the most common beginner mistakes. Deeper research into earnings, free cash flow, and balance sheet quality always follows this initial review.