Open any stock quote page and you will find a number labeled P/E near the price, market cap, and volume. Most beginners skip past it. Experienced investors treat it as one of the first data points worth reading on every stock they consider. The P/E ratio — short for price-to-earnings ratio — measures how much investors currently pay for every dollar of a company’s earnings. A P/E ratio of 20 means investors are paying $20 for every $1 of earnings the company generates. That single number compresses an enormous amount of market sentiment, growth expectation, and relative valuation into a format you can compare across companies in seconds. Gotrade
What Is the P/E Ratio and How to Calculate It
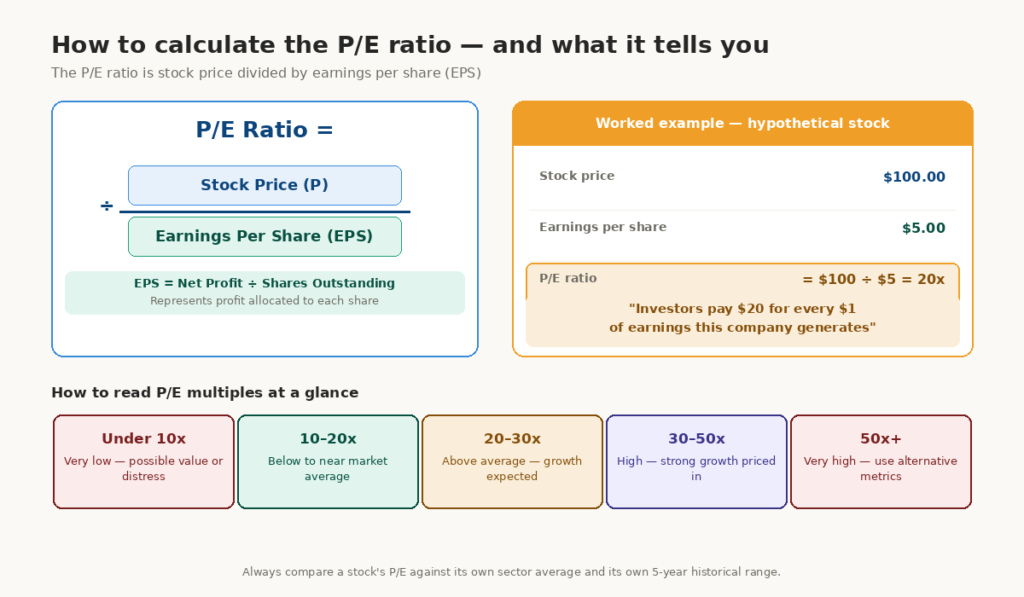
The P/E ratio formula is straightforward. Divide the current stock price by the company’s earnings per share, or EPS. EPS represents the company’s total net profit divided by the total number of shares outstanding. For example, if a stock trades at $50 per share and the company earned $2.50 per share over the last 12 months, the P/E ratio is 50 ÷ 2.50 = 20. This suggests investors are willing to pay twenty times the company’s annual earnings to own the stock. Investing.com
Most brokerage platforms and financial websites calculate and display the P/E ratio automatically. You rarely need to compute it manually. However, understanding the formula matters because it reveals what the number actually represents — a multiple of current earnings, not a percentage or a price target.
| P/E ratio | What it means | Investor interpretation |
|---|---|---|
| 10x | Paying $10 per $1 of earnings | Low multiple — possibly cheap or slow-growing |
| 20x | Paying $20 per $1 of earnings | Near historical S&P 500 average |
| 35x | Paying $35 per $1 of earnings | High multiple — growth expectations built in |
| Negative | Company reporting a net loss | P/E is meaningless — use other metrics |
Historically, the average P/E for the S&P 500 has hovered between 15 and 20. If a stock’s P/E is significantly below this range, it may be considered cheap or undervalued relative to the market. If a stock’s P/E is significantly above this range, it may be considered expensive — a premium the market expects the company to justify through rapid, sustained earnings growth. Investing.com
You can review the SEC’s investor education resources for official guidance on how earnings metrics appear in company filings and stock data.
Trailing P/E vs Forward P/E: Two Different Calculations
Trailing P/E Ratio
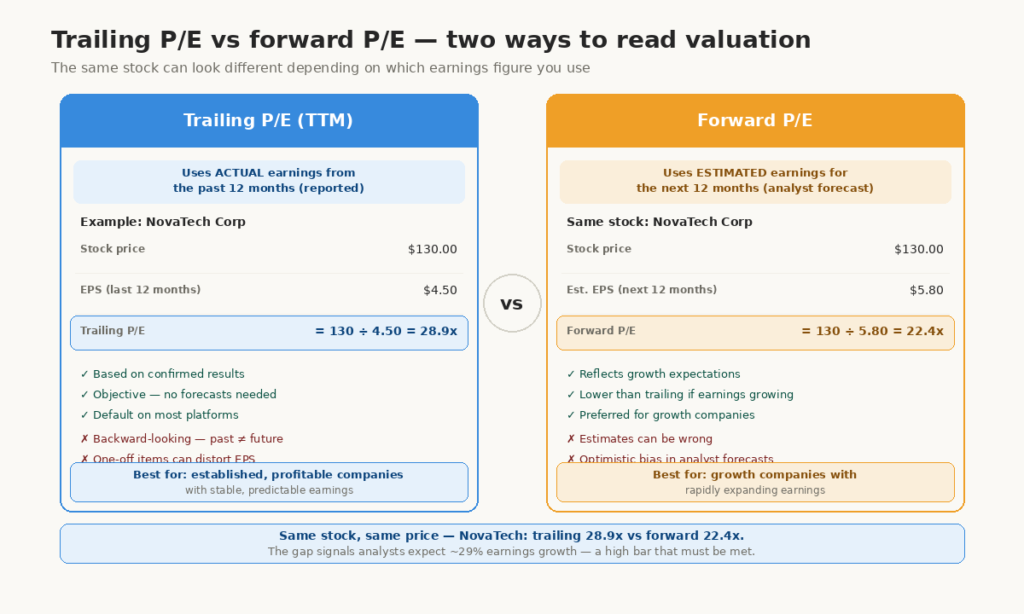
Two main versions of the P/E ratio appear on stock quote pages, and knowing the difference prevents costly misreads. The trailing P/E uses actual reported earnings from the past 12 months. The most widely used approach is the trailing ratio, which uses the company’s trailing 12 months of earnings to calculate EPS. Its popularity stems from its high level of objectivity — the earnings figures are real and reported. Most default P/E displays on Yahoo Finance, Google Finance, and brokerage apps show the trailing P/E unless labeled otherwise. Vision Retirement
Forward P/E Ratio
The forward P/E uses analyst earnings estimates for the coming 12 months instead of actual reported figures. The forward P/E uses projected earnings for the next 12 months. It is based on analyst estimates, which means it reflects expectations rather than confirmed results. When a company’s earnings are growing rapidly, the forward P/E will be lower than the trailing P/E — because the denominator (expected future earnings) is larger than the current year’s figure. Gotrade
Consider a realistic example. Microsoft’s trailing P/E might show 32x based on the past year’s reported earnings. Its forward P/E might show 27x if analysts project 20% earnings growth over the next year. A disciplined investor compares both figures together. A large gap between trailing and forward P/E signals high growth expectations — but also higher risk if those estimates prove inaccurate.
| Metric | Uses | Reliability | Best for |
|---|---|---|---|
| Trailing P/E | Last 12 months actual earnings | High — based on reported data | Established, profitable companies |
| Forward P/E | Next 12 months estimated earnings | Lower — based on forecasts | Growth companies with rising earnings |
| Shiller P/E (CAPE) | 10-year inflation-adjusted earnings | Very high | Broad market valuation assessment |
What Is a Good P/E Ratio by Sector
P/E Ratios Differ Dramatically Across Sectors
No single number qualifies universally as a good P/E ratio. Context — specifically sector, growth rate, and interest rate environment — determines whether a given multiple represents value or overvaluation. As of January 1, 2026, the Information Technology sector traded at a P/E of 39.91 and Energy at 16.62, reflecting very different growth expectations between the two sectors. Comparing a technology company’s P/E to an energy company’s P/E produces a meaningless result. Comparing within the same sector reveals genuine relative value. Siblis Research
Growth-oriented sectors such as technology, consumer discretionary, and industrials command premium P/E ratios of approximately 25 to 41, reflecting strong investor confidence in their future earnings potential. Defensive sectors including consumer staples, utilities, and financials tend to trade at lower multiples of approximately 16 to 21, due to their slower but steady earnings expansion. Siblis Research
How Interest Rates Affect P/E Ratios
Interest rates directly influence what P/E multiple the entire market accepts. When interest rates are low, investors often accept higher P/E ratios because the risk-free return from bonds is less appealing. When rates rise, P/E ratios often compress. This relationship explains why technology stocks with high P/E ratios fell sharply in 2022 when the Federal Reserve raised interest rates aggressively. Rising rates make future earnings worth less today in present value terms — which mathematically justifies a lower multiple. Investing.com
A Practical Example: Apple vs a Utility Company
Suppose Apple trades at a trailing P/E of 30x and a utility company trades at 16x. A beginner might assume the utility stock offers better value. However, Apple’s earnings grow at double-digit rates annually while the utility company grows at 3% to 4% per year. Investors rationally pay more for faster earnings growth. The higher P/E compensates for stronger expected future returns — as long as Apple delivers that growth. Our related guide on how to read a stock quote explains where to locate the P/E ratio alongside other essential metrics.
How Smart Investors Use the P/E Ratio
Using P/E as a Comparison Tool
Disciplined investors compare a stock’s current P/E against three benchmarks simultaneously. First, they compare against the stock’s own five-year historical average P/E. A stock trading well above its own historical range may carry elevated risk. Second, they compare against its direct sector peers. Third, they compare against the broader S&P 500 average to assess relative market premium or discount.
Limitations Every Investor Must Know
The P/E ratio has real blind spots. Earnings can be affected by one-off items such as asset sales or write-downs, making P/E temporarily look very high or very low. If earnings are zero or negative, P/E cannot be used. The P/E focuses only on price and earnings, not on debt or cash — two companies with the same P/E can have very different financial risk. Gotrade
Furthermore, recency bias causes many investors to extrapolate recent earnings trends too far into the future. A company reporting record earnings in a strong economy may carry a low P/E that looks attractive — but disciplined investors ask whether those earnings are sustainable or cyclically inflated. Loss aversion prevents investors from selling overvalued high-P/E stocks because previous gains feel like they justify the premium indefinitely.
Common Beginner Mistakes With the P/E Ratio
Many beginners assume a low P/E always signals a bargain. A company trading at 8x earnings may carry that low multiple because analysts expect earnings to decline, debt levels are dangerous, or the business model faces structural disruption. This mistake is called a value trap — buying what appears cheap only to watch earnings fall and the multiple remain depressed.
Conversely, some beginners avoid all high P/E stocks, missing strong compounding businesses. NVIDIA traded at what appeared to be an extreme P/E multiple in 2022 before AI demand accelerated its earnings growth dramatically. Investors who dismissed it solely on P/E basis missed one of the decade’s strongest earnings expansions.
For further reading, explore these related guides:
What is a good P/E ratio for a beginner investor to target?
No universal good P/E ratio exists for all situations. However, beginners can use the S&P 500 historical average of roughly 15 to 20 as a starting reference point. A stock trading below 15x earnings in a stable sector may warrant a closer look. A stock above 35x requires clear evidence of strong earnings growth to justify the premium. Always compare within the same sector first, then check the company’s own five-year average P/E before drawing any conclusions.
Why do some growth stocks have very high P/E ratios without being overvalued?
Investors pay a high multiple for growth stocks because they are buying future earnings, not just current earnings. A company growing earnings at 30% annually doubles its earnings roughly every 2.5 years. Investors who pay 40x today may be paying a reasonable multiple on earnings three years from now. This logic works when growth actually materializes — and fails dramatically when it does not. High P/E stocks carry higher risk precisely because more optimistic assumptions must prove true to justify the price.
Does a negative P/E ratio mean a company is a bad investment?
A negative P/E ratio simply means the company reported a net loss during the trailing 12-month period. The metric becomes mathematically undefined when earnings are negative. Many strong long-term companies, including Amazon in its early growth years, operated at a loss while building dominant business positions. For companies with negative earnings, investors use alternative metrics such as price-to-sales, price-to-free-cash-flow, or forward P/E based on projected profitability to assess valuation.