Last updated: July 6, 2026
Stock market history follows a clear rhythm: prices rise for years, then fall sharply, then rise again. Understanding market cycles — the alternating periods of sustained gains and sustained losses — helps investors stay calm during extreme price swings and make better decisions at every phase.
What Bull and Bear Market Cycles Mean for Stock Returns
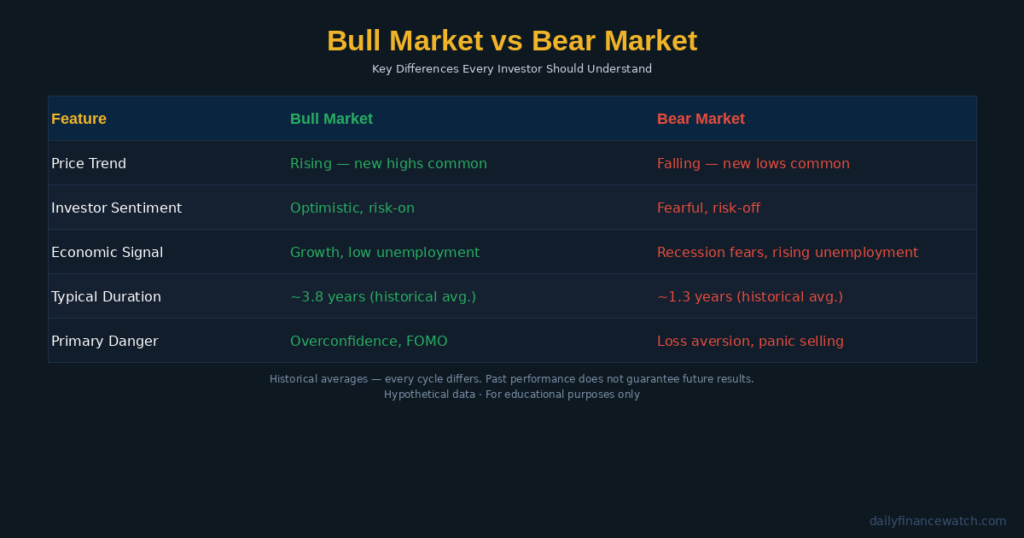
Caption: Bull and bear markets defined side by side — key signals, typical duration, and the behavioral traps each phase creates.
A bull market is a sustained rise of 20% or more from a recent low. A bear market is a sustained decline of 20% or more from a recent high. Both use the 20% threshold as a standard dividing line. The S&P 500 Index serves as the most common benchmark for measuring these phases in the United States.
| Feature | Bull Market | Bear Market |
|---|---|---|
| Price Trend | Rising — new highs common | Falling — new lows common |
| Investor Sentiment | Optimistic, risk-on | Fearful, risk-off |
| Economic Signal | Growth, low unemployment | Recession fears, rising unemployment |
| Typical Duration | ~3.8 years | ~1.3 years |
| Primary Danger | Overconfidence, FOMO | Loss aversion, panic selling |
These figures are historical averages. Every cycle differs in length and scale. According to Investor.gov, the SEC’s official investor education resource, markets rise over the long term — but sharp declines are a normal part of that trajectory.
How Bull Market Signals Develop
A bull phase typically begins when sentiment shifts from fear to cautious optimism. Corporate earnings recover, unemployment falls, and consumer spending rises. Institutional investors — pension funds, mutual funds, and hedge funds — then allocate more capital to equities. This increases demand and pushes prices higher. The longest modern U.S. bull market ran from 2009 to 2020, lasting roughly 11 years. The S&P 500 gained more than 400% from its post-crisis low during that period. These figures are cited for educational context only and do not represent future outcomes.
How Bear Market Signals Develop
A bear phase typically begins when earnings disappoint, economic growth slows, or an external shock undermines confidence. The 2007–2009 bear market lasted about 17 months. The S&P 500 fell roughly 57% from peak to trough during that period. The COVID-19 bear market of 2020 lasted only 33 days before reversing sharply. These historical reference points are for educational purposes and do not predict future cycles.
How Long Each Market Cycle Typically Lasts
Bull markets have historically lasted much longer than bear markets. This asymmetry is one of the strongest arguments for staying invested through downturns rather than exiting early.
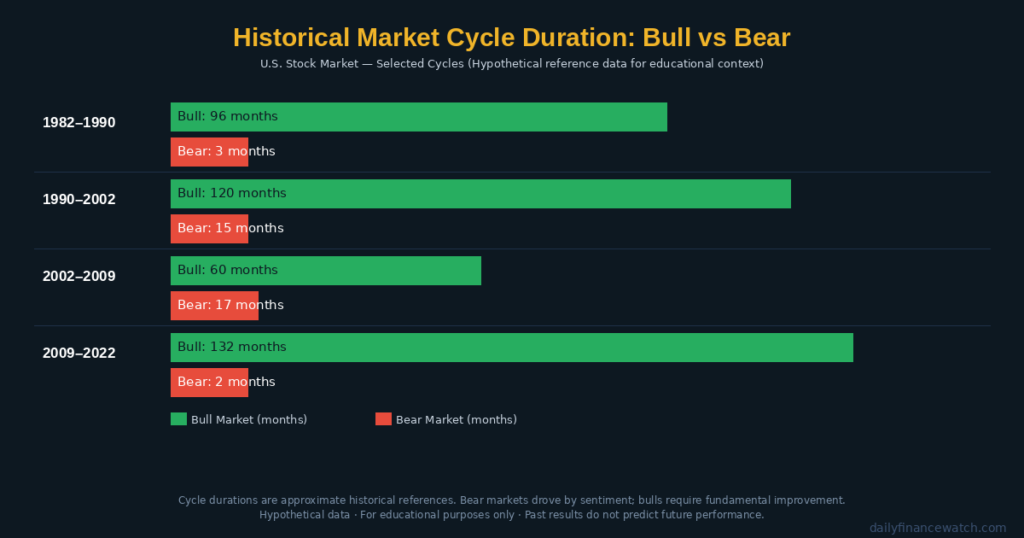
Caption: Bull phases have historically lasted longer and produced larger moves than the bear declines that followed them.
Investors who exit during a bear phase and wait for certainty before returning often miss the early weeks of the next bull market. Those early weeks frequently produce the largest percentage gains. According to FINRA’s investor education materials, missing only the 10 best trading days in a decade can dramatically reduce total long-term returns compared to a buy-and-hold approach.
Timing market cycles — selling at the peak and buying at the trough — is historically difficult even for professional investors with dedicated research teams. This does not mean holding every position indefinitely. However, reactive selling based on fear has a poor long-term record.
For more on price swings and what triggers them, see what market volatility means for your portfolio.
How Disciplined Investors Position Across Market Cycles
Disciplined investors treat market cycles as context, not instructions. A bear market does not mean every stock should be sold. A bull market does not mean every stock should be bought. Instead, investors use the current phase to calibrate risk and identify relative opportunities.
Sector Rotation During Bull Phases
During bull market cycles, institutional capital often rotates toward higher-growth sectors — technology, consumer discretionary, and small-cap stocks. Relative strength analysis, which compares a stock’s performance to its sector or benchmark, can indicate where institutional buying concentrates. For example, a hypothetical investor watching NVIDIA during the AI-driven bull run of 2023 would have observed strong relative strength versus the broader S&P 500. This may suggest where momentum is building, but it does not guarantee continued outperformance.
Sector Rotation During Bear Phases
During bear market cycles, institutional capital typically shifts toward defensive sectors — consumer staples, utilities, and healthcare. These sectors tend to maintain earnings through economic downturns. Dividend-paying stocks with low payout ratios and strong free cash flow often show relative strength during bear phases. Income-focused investors seek predictable cash flow when capital appreciation is limited. A disciplined investor may compare free cash flow yield across defensive holdings before adding exposure during a bear phase. This does not guarantee protection from losses.
Common Mistakes and the Psychology Behind Them
How Investor Psychology Shifts With Market Cycles
Two behavioral patterns cause the most damage across market cycles: FOMO and loss aversion. FOMO — fear of missing out — drives investors to buy aggressively near market peaks, after most gains have already occurred. Loss aversion describes the tendency to feel losses roughly twice as strongly as equivalent gains. This drives investors to sell near market troughs, locking in losses at the worst moment.
Recency bias — the tendency to expect recent trends to continue — causes investors to feel most confident near peaks and most fearful near troughs. This is the opposite of what a disciplined accumulation approach would recommend. Recognizing these patterns creates the pause needed for calmer decisions during emotionally charged periods.
When Holding Through a Bear Market Makes Sense
Holding through a bear market makes most sense when three conditions apply: the underlying business remains financially sound, the investor’s time horizon extends beyond the expected bear market duration, and the investor has sufficient liquidity elsewhere to avoid forced selling at depressed prices. When any of these conditions is absent, a more active review of positions may be appropriate.
Disciplined investors also distinguish between a valuation-driven correction — where prices were simply too high — and a bear market driven by genuine economic deterioration. Valuation corrections often recover faster. Economic deterioration bears typically take longer to resolve, since actual business conditions must improve, not just investor sentiment.
What is the standard definition of a bull market in the United States?
A bull market is defined as a rise of 20% or more in a major index — most commonly the S&P 500 — from a recent low, sustained over months. No official regulatory body mandates this threshold, but market professionals and financial media use it consistently. The 20% level separates a bull market from a short-term rally within a broader bear decline.
Why do bear markets tend to be shorter than bull markets?
Bear markets are historically shorter because fear and sentiment can shift rapidly once conditions stabilize. Bull markets require actual earnings and economic improvement — a slower, more gradual process. Central banks and governments also tend to respond aggressively to sharp downturns with monetary or fiscal stimulus, which can shorten bear market duration compared to bull phases.
How should a long-term investor respond when a bear market begins?
Most long-term investors benefit from reviewing position quality rather than making reactive sales. Selling during a downturn locks in losses and creates the risk of missing the early recovery. Bear markets are useful times to check whether each holding’s original investment thesis still holds, confirm adequate liquidity outside equity positions, and reassess overall risk tolerance. Panic selling near a trough has historically produced poor long-term outcomes.
This article is for educational purposes only and does not constitute personalized financial or investment advice. All investing involves risk, including the possible loss of principal.