Last updated: July 4, 2026
Stock volatility measures how much a stock’s price moves up or down over a given period. When stock volatility is high, prices swing sharply in both directions — sometimes within a single trading day. When it is low, prices move in a narrower, steadier range. Every investor who holds equities will face periods of both extremes, and knowing what drives each condition makes it easier to act with discipline rather than react with fear.
What Stock Volatility Means and How It Is Measured
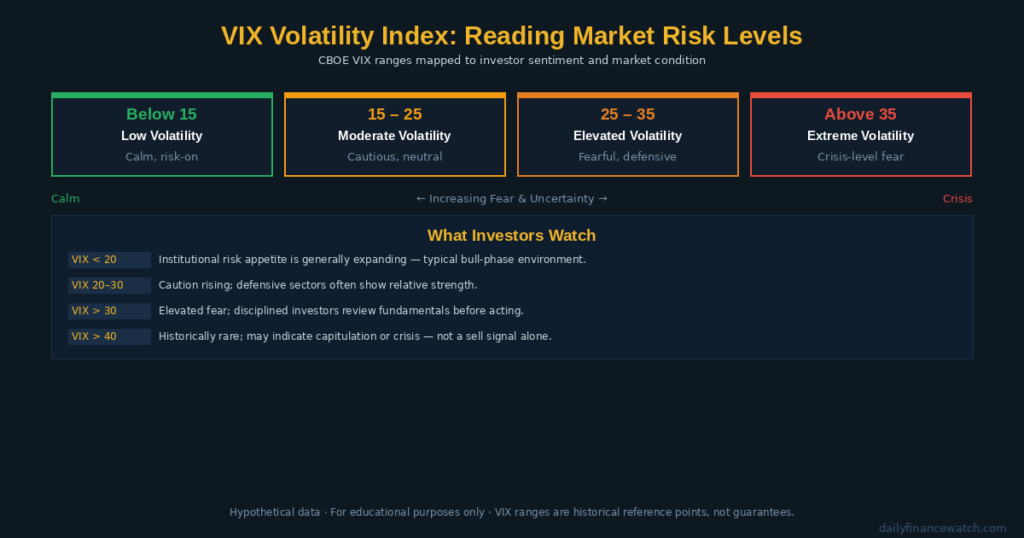
Caption: Volatility levels — low, moderate, and high — mapped to typical VIX ranges and what each signals about market risk appetite.
Volatility refers to the statistical measure of price dispersion around an average return. In practical terms, it answers one question: how much does this price move? A stock that gains or loses 1% per day shows low volatility. A stock that swings 5–10% per day shows high volatility.
The most widely followed volatility gauge in the U.S. market is the CBOE Volatility Index, commonly called the VIX. The VIX measures the market’s expectation of S&P 500 price swings over the next 30 days, derived from options pricing. According to the CBOE’s official VIX methodology, a VIX reading below 20 generally reflects calm market conditions, while readings above 30 signal elevated uncertainty.
| VIX Range | Market Condition | Investor Sentiment |
|---|---|---|
| Below 15 | Low volatility | Calm, risk-on |
| 15–25 | Moderate volatility | Cautious, neutral |
| 25–35 | Elevated volatility | Fearful, defensive |
| Above 35 | Extreme volatility | Crisis-level fear |
These ranges are general reference points based on historical VIX behavior. They do not predict future market movements.
How Volatility Differs From Risk
Many beginners treat volatility and risk as the same concept. They are related, but not identical. Volatility describes how much a price moves. Risk describes the probability of a permanent loss of capital. A highly volatile stock can recover fully after a sharp decline. A low-volatility stock in a deteriorating business can produce a permanent loss with very little daily price movement. A disciplined investor considers both dimensions separately before committing capital.
What Causes Sudden Spikes in Market Volatility
Several forces drive volatility higher. Understanding each one helps investors distinguish between temporary turbulence and a genuine shift in market conditions.
Earnings surprises move individual stock prices sharply when reported results differ significantly from analyst expectations. A company that misses earnings estimates by a wide margin can drop 10–20% in a single session. For example, a hypothetical company reporting earnings per share of $1.20 against an expected $1.80 would likely face a severe single-day decline.
Macroeconomic data releases — including inflation reports, Federal Reserve interest rate decisions, and employment figures — move the broader market when the data diverges from consensus forecasts. A higher-than-expected inflation print, for instance, can trigger rapid selling in growth stocks as investors reprice expected future earnings at a higher discount rate.
Geopolitical events and sudden external shocks — such as a pandemic, a banking crisis, or an unexpected policy change — compress decision-making time for institutional investors. This compression amplifies price swings in both directions.
Liquidity conditions also affect volatility. When trading volume is thin — during holidays or in smaller-cap stocks — individual large orders can move prices far more than the same order would move a large-cap stock with deep order books.
Volatility and Investor Psychology
Volatility activates two of the most destructive behavioral patterns in investing. Loss aversion — the tendency to feel losses roughly twice as intensely as equivalent gains — causes investors to sell during sharp declines, locking in losses at the worst possible moment. Recency bias — the tendency to expect recent conditions to continue — causes investors to assume high volatility will persist indefinitely, even when historical data shows volatility tends to mean-revert. Both errors compound over time and reduce long-term returns significantly. Recognizing these tendencies creates the pause needed for calmer, more deliberate decisions during turbulent periods.
How Disciplined Investors Respond to Volatile Markets
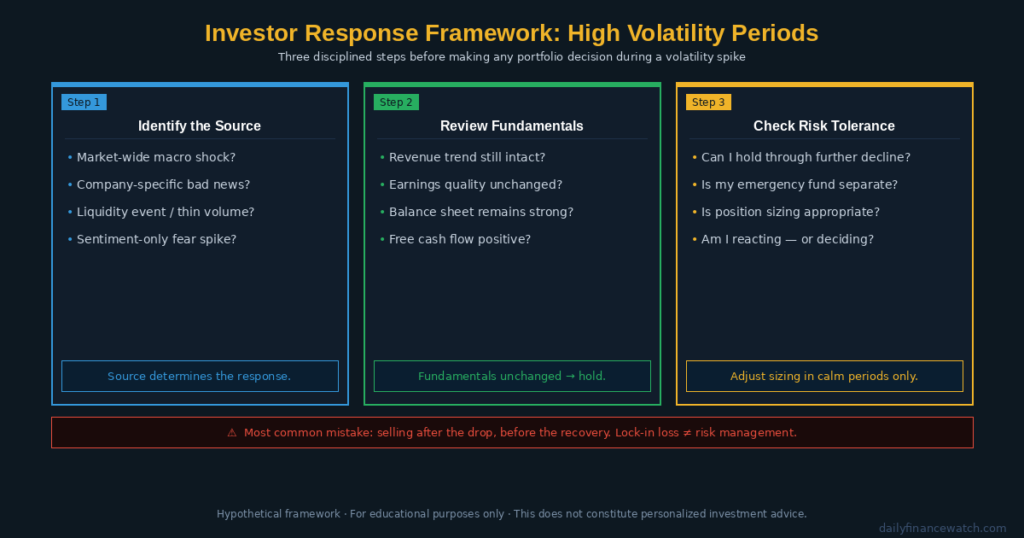
Caption: A structured decision framework helps investors distinguish between temporary volatility and fundamental deterioration before acting.
Disciplined investors treat volatility as information, not instruction. A spike in the VIX signals elevated uncertainty — it does not automatically mean stocks should be sold. The appropriate response depends on three factors: the source of the volatility, the quality of the holdings, and the investor’s time horizon.
Three Practical Responses to High Volatility
Review, do not react. High volatility is the wrong time to make major portfolio changes. Decisions made during peak fear are disproportionately driven by emotion rather than analysis. A disciplined investor may review each position’s underlying fundamentals — revenue trend, earnings quality, balance sheet strength, and free cash flow — before deciding whether to hold, reduce, or add.
Check position sizing. Volatility often reveals whether a portfolio carries more risk than the investor can tolerate psychologically. If a 10% portfolio decline triggers serious anxiety, that may indicate the equity allocation is too large relative to the investor’s actual risk tolerance. Adjusting position sizing during calm periods — not during a spike — produces better outcomes.
Consider dollar-cost averaging. Investors who add to positions at regular intervals — regardless of short-term price swings — reduce the impact of volatility on their average cost per share. For example, a hypothetical investor who adds $500 to an S&P 500 index fund like SPY every month accumulates more shares during high-volatility periods when prices are depressed. This does not guarantee profit, but it removes the pressure of timing individual purchases.
According to FINRA’s investor education resources, investors who maintain consistent contribution habits through volatile periods historically achieve better long-term outcomes than those who stop contributing during downturns.
For more on how volatility connects to broader market phases, see what bull and bear market cycles mean for your returns.
Common Mistakes Investors Make During High Volatility
Selling at the Bottom
The most common and costly volatility mistake is selling after a sharp decline. This action locks in the loss and removes the investor from the subsequent recovery. Bear markets and volatility spikes share one consistent pattern: the fastest recoveries follow the sharpest drops. An investor who sold during the COVID-19 volatility spike of March 2020 missed one of the strongest 12-month recoveries in S&P 500 history. These historical events are cited for educational context and do not predict future outcomes.
Confusing Volatility With Fundamental Deterioration
Volatility driven by market-wide fear — a macro shock, a liquidity event, or a sentiment shift — is different from volatility driven by a specific company’s declining fundamentals. A stock that drops 15% because the VIX spiked across the whole market may represent a different opportunity than a stock that drops 15% because its largest customer cancelled a major contract. Disciplined investors investigate the source before deciding how to respond.
Checking Prices Too Frequently
Behavioral finance research consistently shows that investors who check their portfolio prices more frequently feel worse about their performance and make more reactive decisions — even when their long-term returns are identical to investors who check less often. During high-volatility periods, reducing check frequency often improves decision quality without changing any other variable.
What is the VIX and what does a high reading mean?
The VIX, or CBOE Volatility Index, measures the market’s expectation of S&P 500 price swings over the next 30 days. It derives from options pricing — when traders pay more for options protection, the VIX rises. A reading above 30 generally signals elevated fear and uncertainty in the market. A reading below 15 signals calm conditions. The VIX reflects expected volatility, not a directional prediction for prices.
Why does stock volatility tend to increase during bear markets?
Volatility rises during bear markets because uncertainty about earnings, economic conditions, and policy responses increases sharply. Institutional investors reduce risk exposure simultaneously, which amplifies selling pressure and price swings. Fear-driven decision-making also compresses time horizons — investors who normally think in years begin reacting to daily price changes, which increases the frequency and size of individual moves.
Should investors stop contributing to their portfolio during high volatility?
Most long-term investors benefit from continuing regular contributions during high-volatility periods rather than pausing. Stopping contributions during a downturn means buying fewer shares at lower prices — the opposite of what a disciplined accumulation strategy would prescribe. High volatility combined with lower prices can reduce the average cost per share for investors who continue to contribute consistently. However, investors should confirm they have adequate emergency reserves before investing any capital.
This article is for educational purposes only and does not constitute personalized financial or investment advice. All investing involves risk, including the possible loss of principal.