Last updated: June 29, 2026
Every time the Federal Reserve raises interest rates, cuts them, or announces a bond-purchasing program, money flow across global markets shifts — sometimes within minutes. Money flow refers to the movement of capital between asset classes, sectors, currencies, and economies in response to changing financial conditions. For stock investors, understanding how central banks direct that flow is one of the most practical macro skills available, because the same policy decision that drains capital from one sector often floods another.
How Central Banks Create and Direct Money Flow
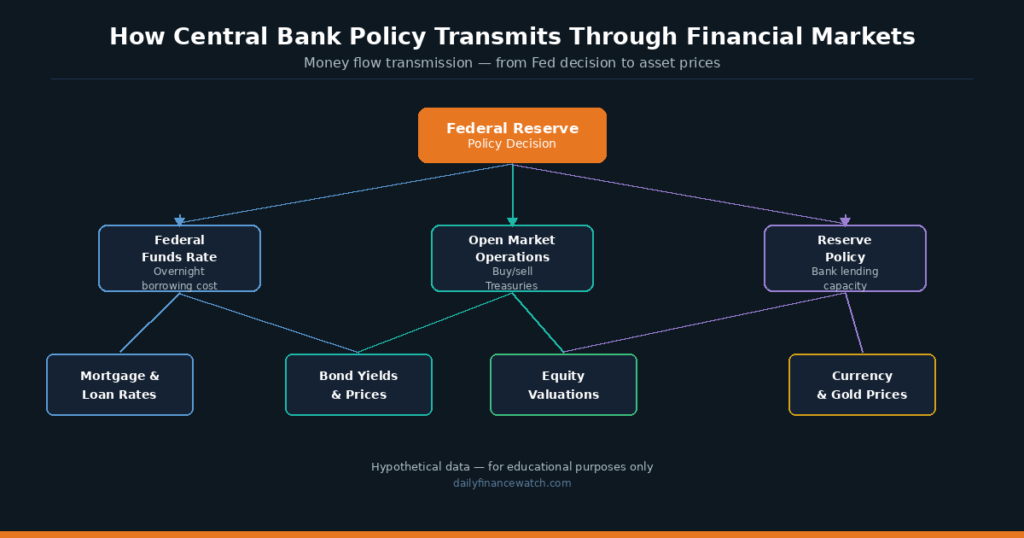
Caption: A single Fed policy decision travels through multiple transmission channels before reaching consumer borrowing rates and equity valuations.
Central banks do not lend money directly to businesses or households. Instead, they influence the cost and availability of money through a set of policy tools that ripple outward through the banking system and financial markets. The Federal Reserve — the U.S. central bank — operates through three primary channels: the federal funds rate, open market operations, and reserve policy.
The federal funds rate is the interest rate at which commercial banks lend reserve balances to each other overnight. When the Fed raises this rate, borrowing costs rise across the entire economy. Banks pass higher costs to businesses and consumers through elevated loan rates, mortgage rates, and credit card interest. As a result, borrowing slows, spending contracts, and money flow into rate-sensitive sectors such as real estate and consumer discretionary tends to fall.
The Three Main Transmission Channels
| Policy Tool | How It Works | Primary Market Effect |
|---|---|---|
| Federal Funds Rate | Sets overnight interbank lending cost | Shifts capital between equities, bonds, and cash |
| Open Market Operations | Fed buys or sells Treasury securities | Expands or contracts bank reserves and credit supply |
| Reserve Requirements | Minimum reserves banks must hold | Amplifies or limits bank lending capacity |
| Quantitative Easing (QE) | Large-scale asset purchases beyond Treasuries | Pushes investors into higher-risk assets |
| Quantitative Tightening (QT) | Fed allows bonds to mature without reinvesting | Drains reserves, tightens financial conditions |
Open market operations are the Fed’s most frequently used tool. When the Fed buys U.S. Treasury bonds from banks, it credits those banks with new reserves. Banks can then use those reserves to extend credit or invest in other assets. This injection expands money flow into the broader economy. When the Fed sells bonds, the opposite occurs — it withdraws reserves from the system, reducing the funds available for lending and investment.
What Quantitative Easing Does to Asset Prices
Quantitative easing — commonly called QE — is a policy the Fed uses when short-term interest rates are already near zero and further rate cuts would have limited effect. During QE, the Fed purchases large quantities of Treasury bonds and mortgage-backed securities directly from financial institutions. These purchases add reserves to the banking system at a scale far beyond normal open market operations.
The immediate effect is a compression of yields on the assets the Fed buys. When bond yields fall, fixed-income investors face lower returns. Consequently, capital rotates toward higher-yielding alternatives — corporate bonds, dividend-paying stocks, real estate investment trusts (REITs), and equities broadly. This portfolio rebalancing effect is intentional. The Fed uses it to stimulate economic activity by making equity and credit financing cheaper and more accessible.
How QE Affected the Stock Market: A Hypothetical Illustration
Consider a hypothetical scenario modeled on the 2020 QE program. The Fed announces $120 billion per month in asset purchases. Ten-year Treasury yields fall from 1.9% to 0.5% within several months. An institutional investor previously allocating 40% to Treasuries at 1.9% now faces a real yield near zero after accounting for inflation. To maintain target returns, that investor rotates capital into S&P 500 dividend payers yielding 2.0–3.0%. This rotation expands equity demand, particularly in sectors like utilities, consumer staples, and technology — which all carry lower near-term sensitivity to economic cycles.
A disciplined investor watching money flow during a QE cycle may observe volume expansion in large-cap growth ETFs, rising price-to-earnings ratios across the index, and narrowing credit spreads in corporate bond markets. These signals can indicate that institutional capital is moving into risk assets — but they do not guarantee continued price appreciation. QE-driven rallies carry the embedded risk that when the program ends, the same capital can reverse course rapidly.
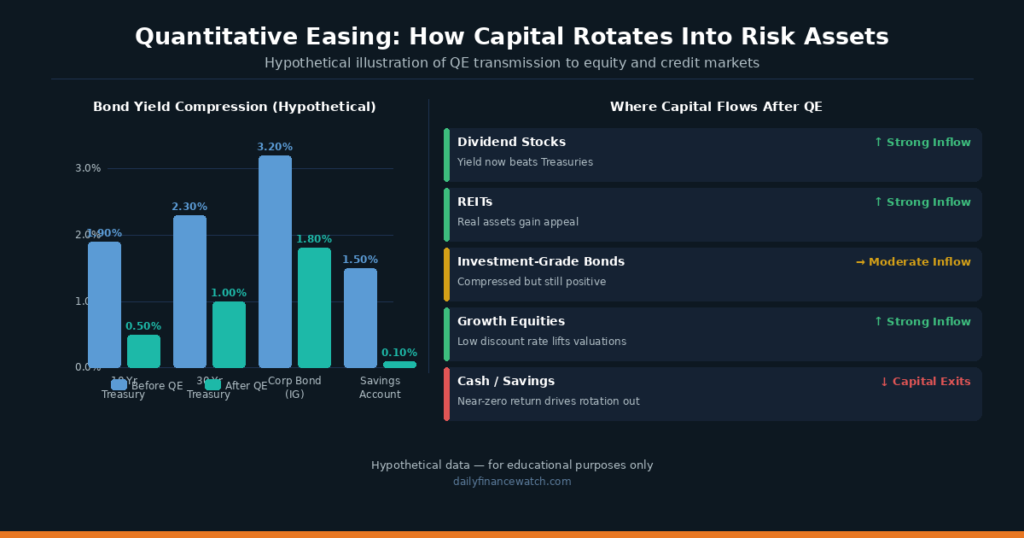
Caption: When QE compresses bond yields, institutional investors rotate capital into equities and credit, expanding valuations across risk assets.
How Tightening Cycles Redirect Money Flow Away from Risk Assets
When inflation rises above the Fed’s 2% target, the central bank typically reverses course. It raises the federal funds rate and may begin quantitative tightening — allowing bonds on its balance sheet to mature without reinvesting the proceeds. Both actions reduce the supply of cheap money in the financial system.
Rising rates increase the attractiveness of cash and short-term Treasuries relative to equities. A two-year Treasury note yielding 5% competes directly with dividend stocks yielding 2–3%. Investors who previously accepted lower equity yields because bonds offered nothing now have a genuine alternative. This dynamic — known as the risk-free rate competition — was a significant driver of equity multiple compression during the 2022 rate hike cycle, when the S&P 500 fell approximately 19% from peak to trough as measured across the calendar year, according to widely reported market data.
You can monitor current Federal Reserve policy decisions, meeting minutes, and balance sheet data through the Federal Reserve’s official monetary policy page. The Fed’s H.4.1 statistical release, published weekly, shows the precise size and composition of the Fed’s balance sheet.
Sector Rotation During Tightening Cycles
Central bank tightening does not affect all sectors equally. Rate-sensitive sectors — utilities, REITs, and consumer staples — tend to underperform as their debt costs rise and their dividend yields become less competitive. Conversely, financial sector companies such as banks and insurers often benefit from wider interest margins when rates rise. Energy and commodity-linked sectors may outperform if inflation is the driver behind the tightening cycle, because commodity prices tend to move with inflationary pressure.
A disciplined investor may track sector relative strength — comparing each sector’s price performance against the S&P 500 as a benchmark — to identify where money flow is concentrating during a tightening cycle. This does not guarantee future performance, but it provides a quantitative signal of institutional positioning beyond headline index moves.
What Investors Watch Beyond the Fed’s Rate Decisions
Central bank communication shapes money flow as powerfully as actual policy changes. The Fed publishes detailed guidance through its Federal Open Market Committee (FOMC) statements, the Summary of Economic Projections (the “dot plot”), and the Fed Chair’s press conferences. Markets often move more on the interpretation of forward guidance than on the rate decision itself.
The FINRA Investor Education Foundation notes that interest rate changes affect not only borrowing costs but also the present value of future earnings — a key input in equity valuation. When investors expect future rates to be higher, they discount future corporate earnings at a higher rate, which reduces the current fair value of growth stocks more sharply than value stocks. This is why money flow during rate hike cycles often rotates from high-multiple growth stocks toward lower-multiple value and dividend stocks.
Investor psychology compounds the effect of central bank policy on money flow. Recency bias leads many investors to assume that the monetary environment of the recent past — whether cheap money or tight money — will persist indefinitely. This bias can cause late entries into trades that have already priced in the policy shift. Loss aversion, the tendency to fear losses more than equivalent gains, can trigger panic selling during the early stages of a tightening cycle even before corporate earnings show deterioration.
A structured approach involves reviewing the Fed’s policy stance at each FOMC meeting — held eight times per year — and asking whether the current sector allocation still makes sense under the prevailing monetary regime. Adjustments should be deliberate and systematic rather than reactive to single data prints or Fed headlines.
For investors deepening this foundation, what is the money supply and what is market liquidity connect directly to the mechanics covered here and extend the framework into practical portfolio application.
FAQ
How does the Federal Reserve move money flow into or out of the stock market?
The Fed does not buy or sell stocks directly. Instead, it changes the cost of money through rate policy and asset purchases, which alters the relative attractiveness of equities versus bonds and cash. Lower rates and QE push investors toward risk assets including stocks, expanding valuations. Higher rates and quantitative tightening make safe fixed-income alternatives more competitive, which can reduce equity demand and compress price-to-earnings multiples across the market.
Why does the bond market react faster than the stock market to Fed decisions?
Bond prices move directly and mathematically with interest rate expectations. When the market prices in a rate hike, bond yields rise immediately because every existing bond’s fixed coupon becomes less valuable relative to new bonds that will pay a higher rate. Stock prices adjust more slowly because equities depend on earnings growth, management execution, and investor sentiment — factors that take time to reflect policy changes. The bond market therefore tends to lead the stock market as a policy signal.
What is the difference between quantitative easing and lowering interest rates?
Lowering interest rates reduces the federal funds rate — the overnight borrowing cost between banks — which indirectly lowers rates across the economy. Quantitative easing involves the Fed directly purchasing assets, primarily Treasury bonds and mortgage-backed securities, to inject reserves into the banking system and push down longer-term yields. Rate cuts work through price signals. QE works through direct balance sheet expansion. Both expand money flow into the economy, but QE is typically deployed when short-term rates are already at or near zero and rate cuts alone would be insufficient.
This content is for educational purposes only and does not constitute personalized financial advice. All investing involves risk, including the possible loss of principal.