Last updated: June 29, 2026
A stock trading 10 million shares per day and a thinly traded small-cap exchanging 8,000 shares per day are both listed on the same exchange. However, they behave in fundamentally different ways when an investor needs to act quickly. Market liquidity describes how easily an asset can be bought or sold at a price close to its fair value. Crucially, the transaction itself should not move the price. For stock investors, liquidity determines execution quality, risk exposure, and the true cost of owning an asset beyond its stated price.
What Market Liquidity Means and Why It Matters
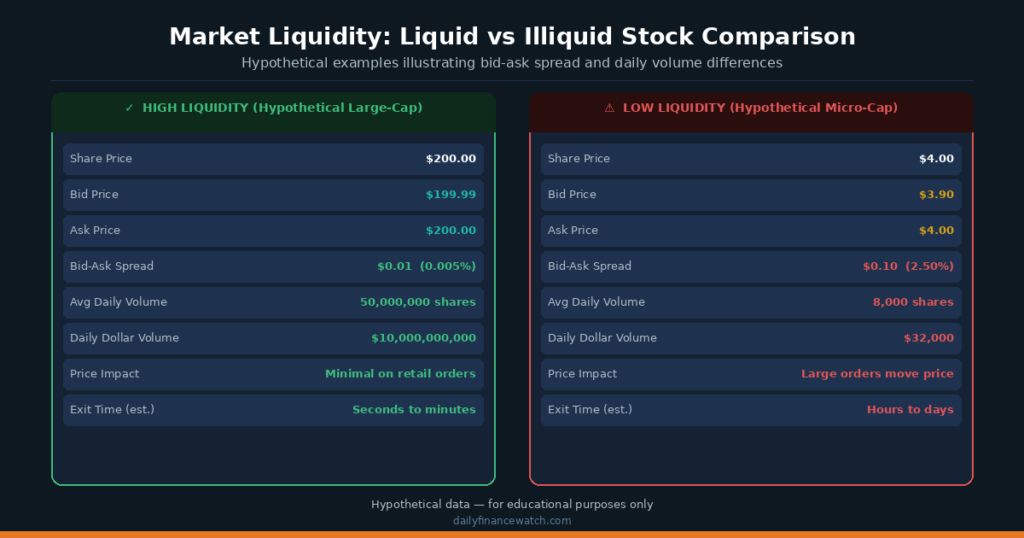
Caption: A narrow bid-ask spread and high daily volume signal strong market liquidity — wide spreads and thin volume signal meaningful execution risk.
Liquidity exists on a spectrum. At one end sit U.S. Treasury bills and large-cap stocks like Apple (AAPL) or Microsoft (MSFT). These assets trade in enormous volumes with penny-wide bid-ask spreads. At the other end sit thinly traded micro-cap stocks, certain corporate bonds, and real estate. Finding a willing buyer or seller at a fair price for these assets can take hours, days, or longer.
The bid-ask spread is the most direct measure of liquidity in a stock. The bid price is the highest price a buyer currently offers. The ask price is the lowest price a seller currently accepts. The difference between the two is called the spread. It represents an immediate transaction cost paid by any investor who buys at the ask and sells at the bid.
How the Bid-Ask Spread Reveals True Transaction Cost
A liquid stock like AAPL may carry a spread of one cent on a $200 share. That represents 0.005% of the transaction. An illiquid micro-cap priced at $4.00 with a $0.10 spread carries an immediate cost of 2.5% — before commissions, taxes, or any price movement. This difference compounds significantly for active traders and even for investors who simply need to exit a position quickly.
| Measure | What It Shows | Liquid Signal | Illiquid Signal |
|---|---|---|---|
| Bid-Ask Spread | Immediate transaction cost | Under $0.05 on most trades | Over $0.25 relative to price |
| Average Daily Volume | Shares traded per day | Millions of shares | Thousands of shares |
| Market Depth | Orders waiting at each price level | Many orders, tight range | Few orders, wide price gaps |
| Price Impact | How much a large order moves price | Minimal movement | Significant price slippage |
| Days to Liquidate | Time to exit without moving price | Under one trading day | Days, weeks, or longer |
Trading volume is the second key signal. High volume means many participants are actively transacting. This keeps prices competitive and spreads narrow. The SEC’s investor education resource at Investor.gov explains that thin trading volume can make it difficult to execute trades at expected prices. This is a risk that retail investors in small-cap or micro-cap stocks face regularly.
How Liquidity Affects Stock Prices and Execution
When a market experiences a sudden liquidity shock, prices can gap downward fast. This speed far exceeds any fundamental deterioration in the underlying business. The March 2020 equity selloff demonstrated this in real time. Institutional investors faced margin calls and redemption requests. They sold liquid assets first — including large-cap equities and even gold — because those were the positions they could exit immediately. Consequently, prices of fundamentally sound businesses fell sharply. Their long-term value had not changed. Buyers had simply withdrawn from the market.
The Value vs Price Distinction During Liquidity Events
This distinction between price and value during liquidity events is critical. A price decline driven by forced selling and reduced market depth is structurally different from a decline driven by genuine earnings deterioration. Disciplined investors watch liquidity indicators alongside price action to tell the two apart.
Not all investable assets carry the same liquidity profile. Understanding where each asset sits on the spectrum helps investors build portfolios that match their actual time horizons and cash needs.
Large-cap U.S. equities — companies in the S&P 500 index — are among the most liquid assets available to retail investors. SPY, the SPDR S&P 500 ETF, regularly trades over 60 million shares per day. Its spreads are measured in fractions of a cent. In contrast, a corporate bond issued by a mid-size company may trade only a handful of times per week. Spreads can exceed 1% of the bond’s face value.
Real estate sits at the far illiquid end. Selling a property typically requires weeks to months, professional intermediaries, and significant transaction costs.
ETF Liquidity: A Closer Look
ETFs introduce an additional layer of liquidity complexity. An ETF’s own trading volume on the exchange matters, but so does the liquidity of its underlying holdings. A thinly traded ETF that holds highly liquid large-cap stocks may be more liquid than its volume suggests. Authorized participants can create or redeem ETF shares against the underlying basket. However, an ETF holding illiquid bonds or small-cap international stocks may face wider spreads and greater price deviation from its net asset value (NAV) during market stress.
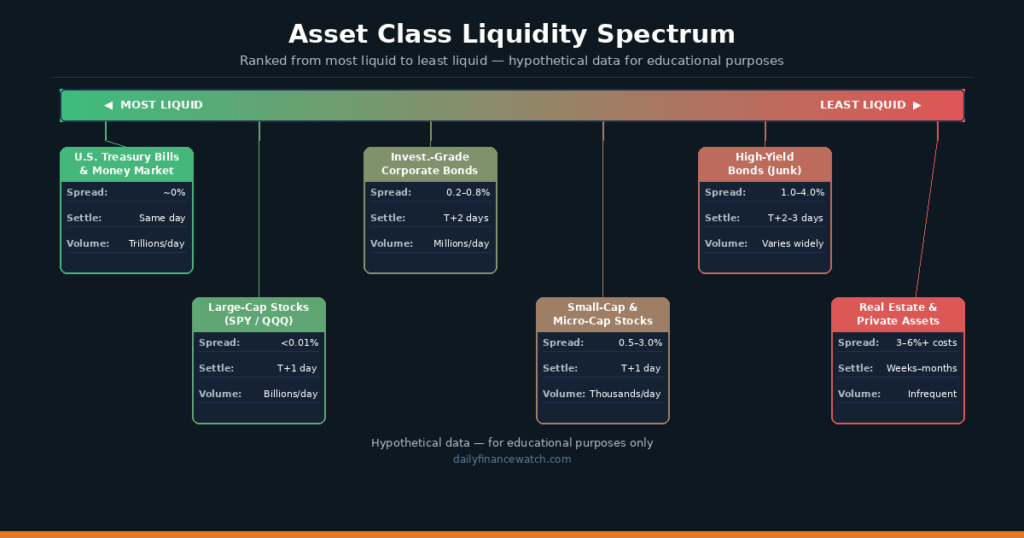
Caption: Liquidity varies sharply across asset classes — from same-day settlement in large-cap equities to weeks-long processes in real estate transactions.
Liquidity Risk: What Investors Often Underestimate
Liquidity risk is the danger that an investor cannot exit a position when needed. Alternatively, they can only do so at a price significantly below fair value. This risk is most acute during market stress. Liquidity tends to evaporate precisely at the moment investors most want to sell.
Consider a hypothetical investor who holds $50,000 in a micro-cap stock. The stock averages 15,000 shares traded per day at $5.00 per share. Daily dollar volume is $75,000. Selling the full $50,000 position — 10,000 shares — represents roughly 67% of one day’s entire trading volume. Attempting to sell that quantity quickly would almost certainly push the price down. This phenomenon is called price slippage. The actual exit price could be meaningfully lower than the price at the time the sell order was entered.
Common Mistakes Investors Make Around Liquidity
Overconfidence bias leads many investors to underestimate liquidity risk during bull markets. When prices are rising and volume is expanding, liquidity feels abundant and permanent. However, liquidity is procyclical. It tends to expand during market optimism and contract sharply during downturns. Investors who build concentrated positions in illiquid assets during calm markets may find themselves unable to exit at acceptable prices when conditions deteriorate.
Recency bias compounds the problem. An investor who has only experienced liquid markets may assume that current conditions are the norm. The lesson from historical liquidity crises — including 2008, 2020, and various emerging market episodes — is that liquidity can disappear faster than most retail investors anticipate. A disciplined investor builds liquidity buffers into portfolio construction. Never assume every position can be exited on demand.
How Disciplined Investors Assess and Manage Liquidity
Smart money analysis of liquidity goes beyond checking daily trading volume. Institutional investors evaluate market depth — the number and size of orders sitting at each price level in the order book. Depth determines how large a position can be established or exited without moving the market. A stock with 1 million shares of daily volume concentrated in a few large block trades carries different practical liquidity than one with 1 million shares spread across tens of thousands of smaller transactions.
A Practical Position-Sizing Rule for Liquidity
A disciplined investor may apply a simple position-sizing rule. Avoid holding more than 5–10% of a stock’s average daily dollar volume in any single position. For a stock trading $500,000 per day in dollar volume, this suggests a maximum position of $25,000–$50,000. That size preserves the ability to exit within one trading session without meaningful price impact. This framework does not eliminate liquidity risk. However, it structures the portfolio so individual positions remain manageable under stress.
Monitoring the Federal Reserve’s financial stability reports provides broader context on systemic liquidity conditions. These reports identify sectors and instruments where liquidity has thinned and where institutional positioning may create crowding risk.
Sector rotation signals can also reflect shifting liquidity conditions. During monetary tightening, institutional investors often reduce exposure to less-liquid small-cap and emerging-market positions first. They rotate into large-cap, high-volume names where they can adjust positions quickly. This pattern can push small-cap indices to underperform not because of fundamental weakness, but because of liquidity preference shifts among large allocators.
Investor psychology plays a consistent role in liquidity dynamics. Herd behavior — the tendency for investors to follow the crowd — intensifies both liquidity expansion and contraction. When fear spreads, sellers rush to exit simultaneously. This overwhelms the pool of available buyers and collapses bid prices. Panic selling is the behavioral expression of a liquidity crisis. Emotional urgency to exit overrides rational assessment of whether a position’s fundamental value has actually changed.
For investors building this framework further, how central banks move money flow and what is the money supply explain the macro forces that directly shape system-wide liquidity conditions across markets.
FAQ
What is the difference between market liquidity and asset liquidity?
Market liquidity refers to the overall ease of buying and selling within a specific market — such as the U.S. stock market or the Treasury bond market — without causing large price disruptions. Asset liquidity refers to the ease of converting a specific asset into cash at or near its fair value. A stock listed on the NYSE benefits from strong market liquidity, but a thinly traded small-cap on that same exchange may still carry poor asset liquidity due to low daily volume and wide bid-ask spreads.
Why does liquidity tend to disappear during market downturns?
Liquidity contracts during downturns because buyers withdraw from the market simultaneously. When fear rises, potential buyers wait for lower prices before committing capital. This reduces the number of active bids in the order book. Sellers who need to exit face a shrinking pool of willing counterparties and must accept lower prices to complete transactions. This self-reinforcing cycle — fewer buyers pushing prices lower, which frightens more sellers into exiting — is what transforms an orderly price decline into a liquidity-driven selloff.
How can a beginner investor protect against liquidity risk?
Beginner investors can reduce liquidity risk through three practices. First, focus the core portfolio on large-cap stocks and broad index ETFs such as SPY or QQQ, which maintain strong liquidity even during market stress. Second, avoid concentrating significant capital in thinly traded micro-cap stocks or illiquid bond funds where exiting quickly carries meaningful cost. Third, maintain a cash reserve outside the investment portfolio so that unexpected expenses never force a sale of illiquid holdings at an unfavorable time. Liquidity planning is a core component of risk management, not an optional add-on.
This content is for educational purposes only and does not constitute personalized financial advice. All investing involves risk, including the possible loss of principal.