Last updated: July 1, 2026
Two funds can track the same 500 companies, charge fees three times apart, and still finish nearly tied after ten years. The expense ratio — the annual percentage a fund charges to operate — explains most of that fee gap, though not the entire outcome. That space between “most” and “entire” is where many beginner guides go quiet.
This charge works quietly. You never receive a bill for it. Instead, the fund subtracts a small slice each day from its assets, so the cost appears only as a slightly lower return. According to the U.S. Securities and Exchange Commission’s guide to mutual fund and ETF costs, these ongoing charges reduce what investors keep. Therefore, even tiny differences deserve a second look.
What an Expense Ratio Actually Costs You
It is the yearly fee a fund charges, shown as a percentage of the money you have invested. A 0.10% rate means $10 per year for every $10,000 you hold. The fee covers management, recordkeeping, and administration. However, it is charged automatically, not billed, so many beginners never notice it leaving.
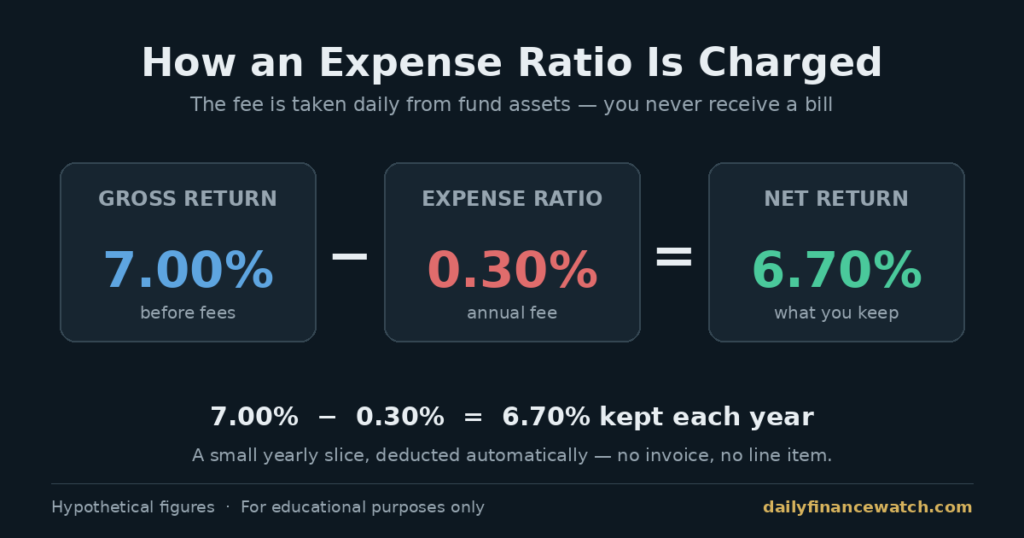
The fee never arrives as a bill — it simply thins the return you receive.
Because the deduction is invisible, the number can feel abstract. For example, 0.03% and 0.30% both look tiny on paper. Over one year on $10,000, that is $3 versus $30 — a rounding error to most people. Nevertheless, funds are held for decades, and that is where the gap stops being trivial.
Costs also vary widely by fund type. Actively managed funds, which pay analysts to pick stocks, usually charge more than index funds that simply track a benchmark. According to the Investment Company Institute’s 2025 fee study, the asset-weighted average expense ratio for equity mutual funds fell to 0.40% in 2025, down from 1.04% in 1996. Index equity ETFs averaged just 0.15%. Over time, competition has pushed these numbers toward zero.
Why the Fee Number Alone Misleads Beginners
Most guides give one rule: pick the fund with the lowest fee. That rule is a fine starting point, yet it treats the expense ratio as a fund’s total cost. In reality, the sticker number leaves out several real expenses. Trading costs, bid-ask spreads, and structural quirks all shape the return you actually receive.
Consider two S&P 500 funds. SPY charges 0.0945%, while VOO charges 0.03% — a threefold fee difference for nearly identical holdings. Over the past ten years, SPY returned about 15.46% per year and VOO about 15.54%, according to PortfoliosLab data. The gap is small, but it runs in the direction the fees predict.
The Cost the Ratio Does Not Show
SPY is built as a unit investment trust. Because of that structure, it must park incoming dividends as cash before paying them out, and it cannot lend securities for extra income. VOO, an open-end fund, avoids both drags. As a result, part of VOO’s edge comes from structure, not the headline fee. This is the total cost of ownership that institutional investors weigh, and it sits outside the fund’s sticker price entirely.
| Fund | Index | Expense Ratio | 10-Yr Return | Structure |
|---|---|---|---|---|
| VOO | S&P 500 | 0.03% | ~15.54%/yr | Open-end |
| SPY | S&P 500 | 0.0945% | ~15.46%/yr | Unit investment trust |
Source: Vanguard, State Street, and PortfoliosLab; returns net of fees as of mid-2026.
Beginner guides often say to always choose the lowest fee and stop there. Among today’s index funds, that advice is nearly hollow, because most already charge close to zero. A 0.01% edge rarely decides an outcome. Instead, professional analysts compare tracking difference — how closely a fund matches its index after all costs — along with structure and tax efficiency. The headline fee is one input, not the verdict.
How Small Costs Compound Over Decades
The reason fees matter is time. A fee removed today cannot compound for you tomorrow. Over a long horizon, that lost growth builds into a visible sum. This means cost discipline is less about any single year and more about the cumulative drag.
A 30-Year Expense Ratio Comparison
Picture $10,000 invested for 30 years at a 7% annual return before fees. The growth rate is hypothetical, but the fee levels are real. A fund at 0.03% (the rate for VOO) leaves you with roughly $75,500. A fund at 0.40% (the 2025 industry average) leaves about $68,000. At 1.04% (the 1996 average), the balance falls near $56,800. Here the only variable changed is the annual fee.
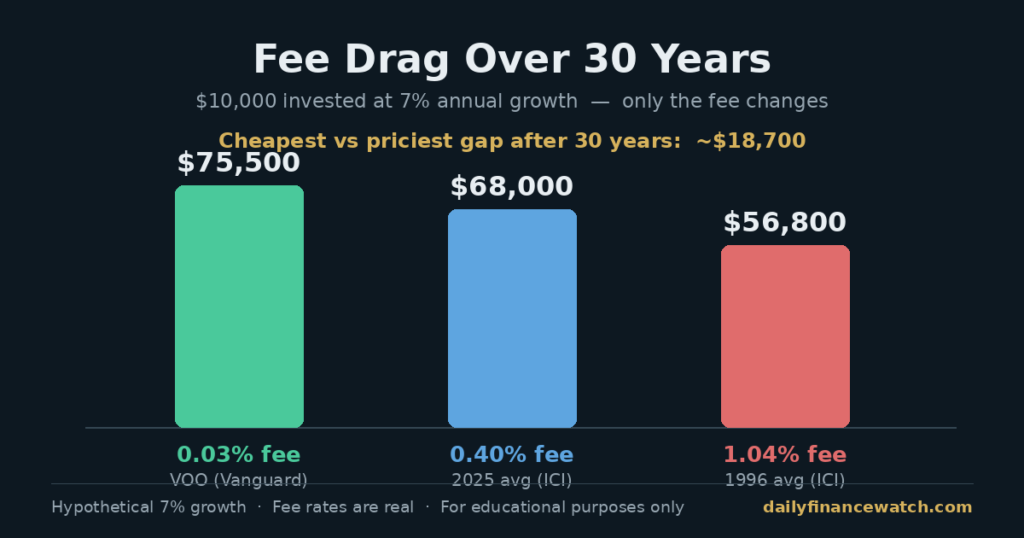
Identical starting money, one variable changed — decades magnify a fraction of a percent.
| Annual Fee | Source of Rate | Value After 30 Years |
|---|---|---|
| 0.03% | VOO (Vanguard) | ~$75,500 |
| 0.40% | 2025 equity fund avg (ICI) | ~$68,000 |
| 1.04% | 1996 equity fund avg (ICI) | ~$56,800 |
Hypothetical 7% annual growth on $10,000; fee rates are real and sourced. Illustration only.
The spread is striking. Between the cheapest and priciest fund, the difference exceeds $18,000 on a $10,000 stake — larger than the original investment. Consequently, cost discipline is not about chasing the last basis point. It protects decades of compounding instead. Past returns never guarantee future results, and all investing carries the risk of loss.
Reading a Fund’s True Cost Without Overpaying
The practical takeaway is a short checklist, not one number. Compare the fee first, then look past it. Check the fund’s tracking difference, its structure, and how it handles dividends and taxes. For a hands-off investor, a broad, low-cost index fund usually covers most of these bases at once.
Large investors rarely stop at the sticker fee. They study total cost of ownership, including trading spreads and tax drag, before moving capital. Fund flows reflect this discipline. The Investment Company Institute reports that 81% of index equity fund assets sit in the lowest-cost quartile. This can indicate where cost-aware money concentrates, though it does not guarantee any fund’s future performance.
Investor psychology plays a quiet role too. Anchoring — the tendency to fix on the first number you see — pushes beginners to judge a fund by its headline fee alone. Two mistakes follow. First, some chase a 0.01% saving while ignoring a weaker structure. Meanwhile, others assume any low fee guarantees a good fund, which it does not. A steadier approach reads the whole cost picture before committing. To see how these low-cost vehicles are built, review what an index fund is and why its structure keeps fees down.
An expense ratio should now read as a starting point rather than a final answer. The number shows the visible, advertised cost. It does not show the tracking difference, the structural drag, or the trading spread that also shape your net return. That is the shift worth keeping: two funds with the same fee — or even a cheaper fund quietly losing to a pricier one — makes sense once you weigh total cost instead of the sticker alone. This article is educational, not personalized advice, and investing always involves risk, including possible loss of principal.
What does a fund’s expense ratio actually pay for?
It covers the fund’s operating costs: portfolio management, recordkeeping, legal and administrative work, and sometimes marketing or distribution charges. The fund deducts it gradually from assets rather than sending a bill. Because it is taken automatically, the fee shows up only as a slightly lower return, which is why many investors never see it directly.
Why do two S&P 500 funds post different net returns?
Both track the same index, so their holdings match closely. However, their fees and structures differ. A higher fee subtracts more each year, and structural details — like how a fund handles dividends or securities lending — add or remove small amounts. Together these gaps produce a modest but real difference in the return investors actually keep over time.
How much do fund fees cost over 20 years?
It depends on the rate and the balance, but the effect compounds. On a $10,000 investment growing near 7% annually, the difference between a 0.03% fund and a 1% fund can reach several thousand dollars over 20 years. According to ICI data, average fees have fallen sharply, which lets long-term investors keep more of their returns than in past decades.
This content is for educational purposes only and is not personalized financial advice. Investing involves risk, including possible loss of principal.