Last updated: July 5, 2026
The debt-to-equity ratio sounds like a single, standard number. It is not. AT&T’s most recent 10-K was filed with the SEC on February 9, 2026. It reported total stockholders’ equity of $126,491 million as of December 31, 2025. Total liabilities came to $293,707 million. That works out to a debt-to-equity ratio of 2.32 using total liabilities. However, many financial data providers report a much lower figure for the same company. That happens because they count only interest-bearing debt, not every liability on the balance sheet. Neither number is wrong. They are simply answering different questions.
What the Debt-to-Equity Ratio Measures
In other words, the debt-to-equity ratio compares what a company owes to what its shareholders have invested. Specifically, the basic formula divides total debt by total stockholders’ equity. Also, a higher ratio means a company relies more on borrowed money relative to owner capital. A lower ratio means the opposite. Generally, a company’s balance sheet reports assets, liabilities, and stockholders’ equity. Together, these figures supply the two inputs this ratio needs. Analysts use the ratio to gauge financial leverage. It says nothing directly about profitability or growth.
Two Different Definitions of Debt
In fact, here is where confusion starts. Some sources define debt as every liability on the balance sheet. Specifically, that includes accounts payable, deferred revenue, pension obligations, and long-term bonds. Other sources define debt more narrowly. Instead, they count only interest-bearing borrowings, such as bonds, term loans, and commercial paper. AT&T’s own FY2025 10-K reports total liabilities of $293,707 million against equity of $126,491 million. That produces a debt-to-equity ratio of 2.32 under the broad, total-liabilities definition. In contrast, a source using the narrow, interest-bearing-debt definition would report a noticeably smaller number for the same company. This happens simply because it excludes items like accounts payable and deferred taxes.
Why This Distinction Actually Matters
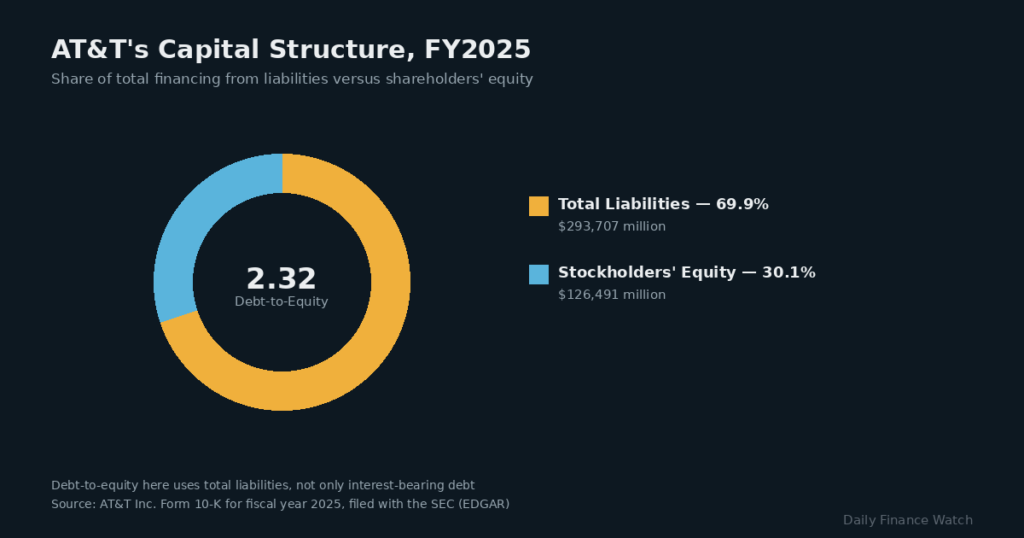
AT&T’s FY2025 balance sheet splits into $293,707M in liabilities and $126,491M in equity.
Comparing two companies without checking which formula each source uses can produce a misleading conclusion. For example, a company using the broad definition might look far more leveraged than a company using the narrow definition. This can happen even if their actual borrowing looks similar. Consequently, the ratio is only meaningful when comparing companies calculated the same way. Therefore, before comparing two companies’ debt-to-equity ratios, it is worth confirming that both numbers come from the same formula. Ideally, both should also come from the same data source.
How Industry Affects a Normal Range
Capital-intensive industries typically carry more total liabilities per dollar of equity than asset-light industries. For instance, telecommunications, utilities, and airlines are common examples of the former. Meanwhile, software companies are a common example of the latter. In fact, building and maintaining physical infrastructure, like AT&T’s wireless and fiber networks, generally requires substantial financing. Software companies, by contrast, rely less on physical infrastructure. As a result, they often carry lighter balance sheets. Therefore, a debt-to-equity ratio that looks high in one industry can be entirely normal in another. Comparing a telecom company’s ratio against a software company’s ratio tells you little on its own. Adjusting for the industry difference first is essential.
Where to Find the Inputs Yourself
According to the SEC’s Investor.gov guide on reading a 10-K, Item 8 of the filing contains the audited balance sheet. It also contains the income statement and the statement of cash flows. Total liabilities and total stockholders’ equity both appear on that balance sheet. For AT&T specifically, that information sits in the company’s FY2025 Form 10-K, filed with the SEC in February 2026. Pulling the numbers directly from the filing avoids relying on a third-party site’s unstated formula.
How to Calculate It Step by Step
First, find total liabilities on the balance sheet, usually a single labeled line. Next, look for total stockholders’ equity, which is also labeled clearly near the bottom of the balance sheet. Then, divide total liabilities by total stockholders’ equity. Overall, the result is the debt-to-equity ratio. For AT&T’s FY2025 figures, that calculation is $293,707 million divided by $126,491 million, or 2.32. Alternatively, some analysts substitute only interest-bearing debt for total liabilities in the numerator. Either approach is valid, provided the source is transparent about which one it used.
A High or Low Ratio Is Not Automatically Good or Bad
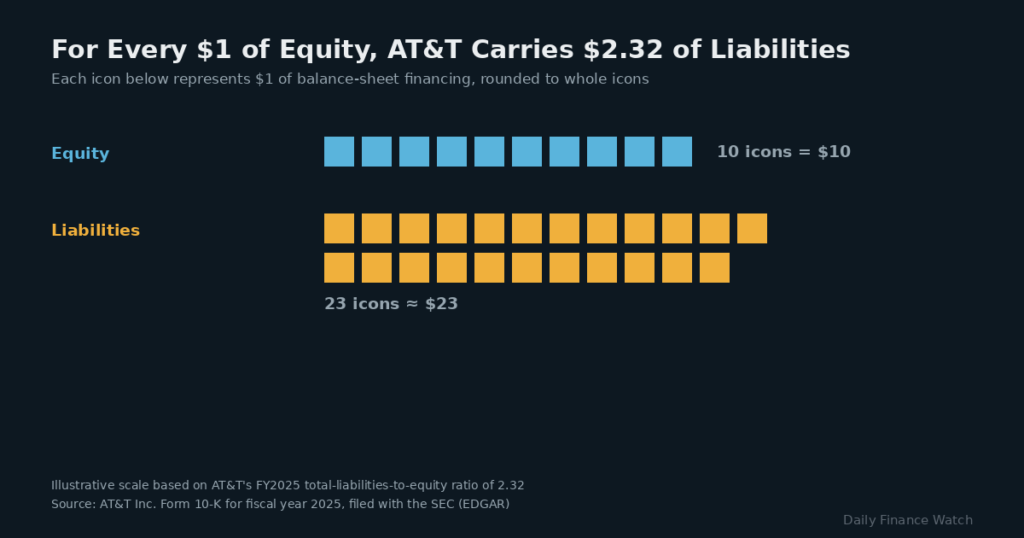
For every $10 of equity, AT&T carries roughly $23 of total liabilities.
A high debt-to-equity ratio is not automatically a warning sign. Likewise, a low one is not automatically a strength. Specifically, debt can fund growth at a lower cost than issuing new equity. This is particularly true when interest rates are low relative to a company’s expected returns. On the other hand, high leverage increases the impact of a revenue downturn on a company’s finances. Ultimately, the ratio describes a capital structure choice. It does not, by itself, describe whether that choice was a good one for a specific company at a specific time.
Debt-to-Equity Ratio Versus Debt-to-Income Ratio
However, the names sound alike, but these ratios measure different things entirely. The debt-to-equity ratio, covered throughout this article, applies to a company’s balance sheet. A debt-to-income ratio, by contrast, applies to a person’s personal finances, comparing monthly debt payments to monthly income. Specifically, lenders use the personal version to evaluate a mortgage or loan application. Meanwhile, investors use the corporate version to evaluate a company’s capital structure. Confusing the two can lead to comparing numbers that were never meant to be compared.
Pairing This Ratio With Others
The debt-to-equity ratio rarely tells the whole story by itself. Pairing it with a P/E ratio, for instance, adds valuation context that leverage alone cannot provide. For example, a company with a high debt-to-equity ratio and a low P/E ratio tells a different story than one with high leverage and a high valuation. Neither ratio alone answers the question of whether a company is fairly priced or soundly financed. Together, though, they start to sketch a more complete picture.
This Is Not a Recommendation to Buy or Avoid Any Company
This article explains how to calculate and interpret the debt-to-equity ratio. It is not a recommendation regarding AT&T or any other specific company. Generally, a single ratio, viewed in isolation, cannot capture a company’s full financial picture. Interest rates, industry norms, growth plans, and cash flow all affect whether a given leverage level makes sense. Consult a financial professional and review a company’s complete financial statements before making any investment decision based on leverage.
Overall, the debt-to-equity ratio is a useful starting point for understanding how a company finances itself. However, that is only true once you know which “debt” a given source is actually measuring. AT&T’s own 10-K shows a ratio of 2.32 under the total-liabilities definition. That same company would look very different under a narrower one. Ultimately, confirming the formula and industry context behind any reported ratio matters more than the number itself.
This article is for educational purposes only and does not constitute financial, investment, or tax advice; consult a licensed financial professional before making decisions about your own portfolio.