Last updated: July 6, 2026
When the U.S. Bureau of Economic Analysis reported that GDP contracted for two consecutive quarters in early 2022, financial media immediately debated whether the economy had entered a recession. The S&P 500 had already fallen more than 20% from its peak. Corporate earnings estimates were being revised downward across multiple sectors. That sequence — GDP data triggering a chain reaction through earnings expectations and stock valuations — repeats across every economic cycle. GDP investing, at its core, means understanding how the rate of economic growth shapes the environment in which every company operates, and using that understanding to make more deliberate portfolio decisions.
What GDP Is and How It Is Measured
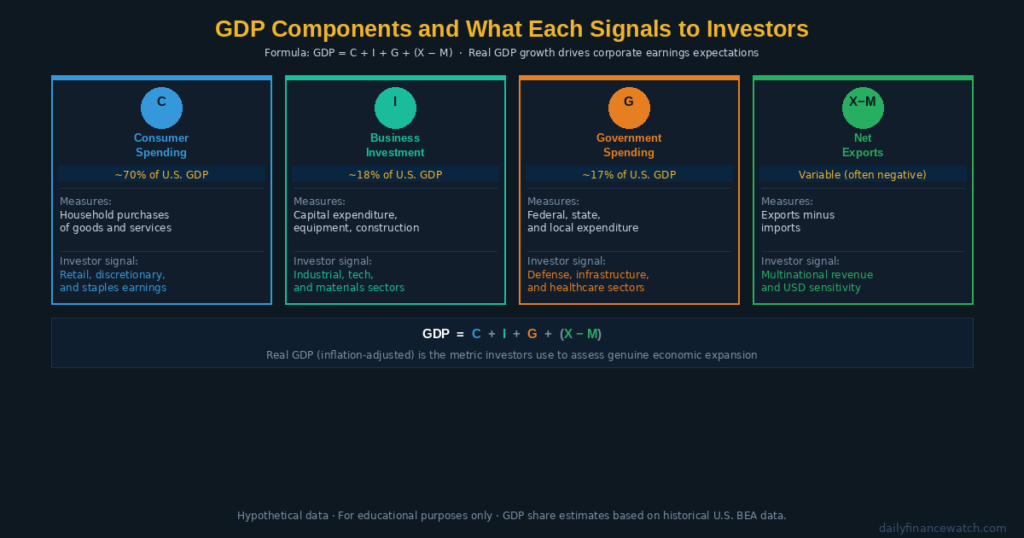
Caption: GDP measures the total value of economic output through four components — each signals a different aspect of the business environment investors need to track.
Gross Domestic Product, or GDP, is the total monetary value of all goods and services produced within a country’s borders during a specific period — typically one quarter or one full year. GDP measures economic output from four components, each of which carries distinct information for investors.
| GDP Component | Formula Symbol | What It Measures | Investor Relevance |
|---|---|---|---|
| Consumer Spending | C | Household purchases of goods and services | ~70% of U.S. GDP; drives retail and discretionary earnings |
| Business Investment | I | Capital expenditure, equipment, construction | Signals corporate confidence and future capacity |
| Government Spending | G | Federal, state, and local expenditure | Affects defense, infrastructure, and healthcare sectors |
| Net Exports | X − M | Exports minus imports | Affects multinational revenue and currency sensitivity |
The standard GDP formula is: GDP = C + I + G + (X − M). According to the U.S. Bureau of Economic Analysis, GDP is published as an advance estimate roughly one month after each quarter ends, followed by two revisions as more complete data becomes available. Investors watch all three releases, but the advance estimate typically produces the largest market reaction because it is the first read on economic conditions for that period.
Real GDP vs Nominal GDP
Two versions of GDP appear in financial reporting, and the distinction matters for investors. Nominal GDP measures output in current prices without adjusting for inflation. Real GDP adjusts nominal GDP for inflation using a price deflator, producing a figure that reflects actual changes in the volume of economic output. During high-inflation periods, nominal GDP can appear to grow robustly while real GDP stagnates or contracts — meaning the economy is producing the same or fewer goods at higher prices rather than genuinely expanding. Disciplined investors focus on real GDP growth as the more meaningful signal for corporate earnings capacity and stock market performance.
The Federal Reserve and most economists target a long-run U.S. real GDP growth rate of approximately 2%–3% per year as consistent with full employment and stable prices. Growth above this range can signal overheating — conditions that typically prompt tighter monetary policy. Growth below this range, or contraction, signals economic weakness that reduces corporate revenue and earnings across most sectors.
What GDP Growth and Contraction Signal for Stock Markets
GDP growth rates directly influence corporate earnings expectations, which drive stock valuations. The relationship is not mechanical — stocks can rise during slow growth and fall during strong growth if expectations diverge from outcomes — but the directional connection is consistent over time.
Strong GDP growth typically signals that consumer spending is expanding, business investment is rising, and labor markets are tightening. These conditions support revenue growth across consumer, industrial, and technology sectors. Institutional investors tend to increase equity exposure and rotate toward cyclical sectors — companies whose earnings are most sensitive to economic conditions — when GDP growth is accelerating.
Weak or negative GDP growth signals that consumer demand is contracting, business investment is falling, and corporate earnings are likely to disappoint. Institutional investors tend to reduce equity exposure and rotate toward defensive sectors — consumer staples, utilities, and healthcare — whose revenues remain relatively stable regardless of economic conditions.
Recessions and Their Market Implications
A recession is conventionally defined as two consecutive quarters of negative real GDP growth, though the National Bureau of Economic Research — the official arbiter of U.S. recession dating — uses a broader set of economic indicators including employment, income, and industrial production. Recessions matter to investors because they create the conditions for sustained earnings declines across cyclical sectors, rising credit risk in corporate bond markets, and increased stock market volatility.
However, stock markets are forward-looking. The S&P 500 typically begins declining months before a recession is officially confirmed, and begins recovering months before GDP growth officially resumes. This timing mismatch means that investors who wait for GDP confirmation before adjusting portfolios often act after the most significant market moves have already occurred. A disciplined investor therefore tracks leading indicators — data that tends to shift before GDP changes — rather than relying solely on the GDP report itself.
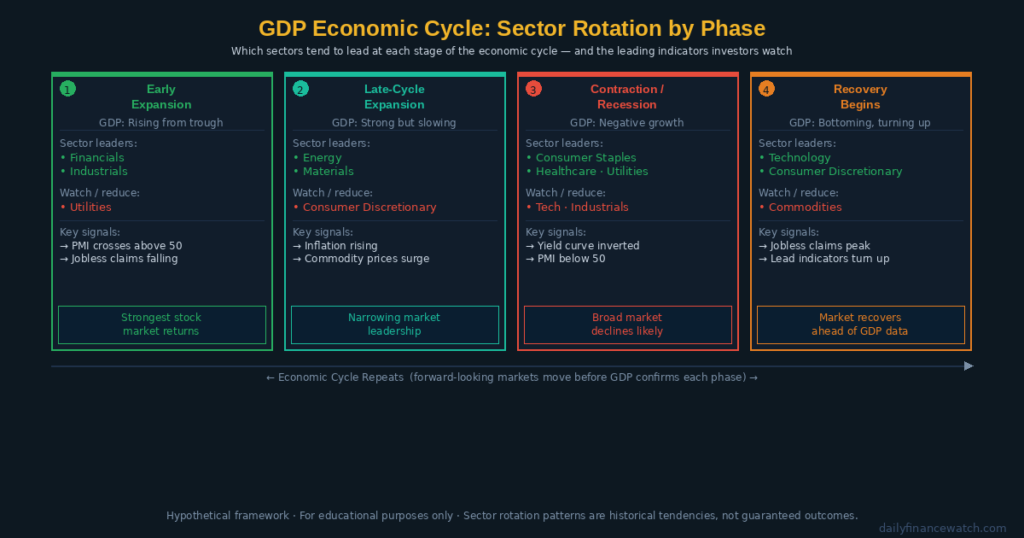
Caption: GDP growth drives corporate earnings cycles — understanding the lead-lag relationship between economic data and stock prices helps investors avoid reactive decisions.
How Investors Use GDP Data in Portfolio Decisions
GDP data does not provide a direct buy or sell signal for individual stocks. However, it shapes the macro environment that affects every company’s revenue, margin, and valuation — making it an essential input for disciplined portfolio management.
Leading Indicators That Anticipate GDP Shifts
Because GDP is a lagging report — it describes what already happened in the previous quarter — disciplined investors track leading economic indicators that tend to move before GDP. Several of these indicators carry high predictive value.
The yield curve — the spread between 10-year and 2-year U.S. Treasury yields — has inverted before every U.S. recession since the 1970s. When short-term rates rise above long-term rates, it signals that financial markets expect economic growth to slow. The inversion does not specify timing precisely, but it shifts the probability distribution for forward GDP growth in a meaningful way.
The Institute for Supply Management’s Purchasing Managers Index, or PMI, surveys business executives about new orders, production, employment, and supplier deliveries. A PMI reading above 50 signals expansion in manufacturing activity. A reading below 50 signals contraction. Because PMI data is released monthly — well ahead of the quarterly GDP report — it gives investors an early read on whether economic activity is accelerating or slowing.
Initial jobless claims, published weekly by the U.S. Department of Labor, measure the number of new unemployment insurance applications filed each week. A sustained rise in jobless claims typically precedes a GDP slowdown because rising unemployment reduces consumer spending, which is the largest single component of GDP.
Sector Rotation Across the GDP Cycle
Disciplined investors use GDP cycle awareness to guide sector allocation. Different sectors of the stock market tend to outperform at different phases of the economic cycle, and understanding these patterns helps investors assess whether their existing holdings are well-positioned for the prevailing macro environment.
During GDP expansion — when growth is above trend and accelerating — cyclical sectors tend to lead. Technology, consumer discretionary, and industrials benefit most from rising corporate investment and consumer confidence. A hypothetical investor reviewing a portfolio during an early GDP expansion phase might assess whether cyclical exposure is sufficient to participate in the earnings growth that expanding economic conditions typically support.
During late-cycle GDP expansion — when growth is strong but beginning to slow — commodity and energy sectors often outperform as capacity constraints and input price pressures build. Inflation tends to rise in this phase, creating the conditions described in how inflation affects stock prices and sector returns.
During GDP contraction or recession — when growth is negative — defensive sectors take the lead. Consumer staples, utilities, and healthcare companies maintain earnings through economic downturns because their products remain essential regardless of the business cycle. Dividend-paying stocks with low payout ratios and strong free cash flow often provide relative resilience during contractionary phases.
During early recovery — when GDP bottoms and begins to expand again — financial stocks and industrials often lead, as credit conditions improve and business investment resumes. This phase also tends to produce the strongest stock market returns, as prices recover from recession lows before the economic data confirms the improvement.
Avoiding the GDP Reaction Trap
Investor psychology creates a predictable error around GDP data releases. Recency bias — the tendency to assume recent conditions will continue — causes investors to extrapolate strong GDP prints into permanently bullish conditions, and weak prints into permanently bearish ones. Both extrapolations lead to poor timing decisions.
Herd behavior amplifies the error. When a weak GDP report triggers broad market selling, investors who follow the crowd sell after the repricing has already occurred — locking in losses at exactly the moment when forward-looking conditions may be improving. A disciplined investor distinguishes between the GDP data itself and what the data implies for future earnings — and between market-wide reactions driven by macro fear and genuine deterioration in the fundamentals of individual holdings.
Furthermore, GDP revisions are significant and frequent. The advance GDP estimate is often revised by 1%–2% in subsequent releases as more complete data becomes available. An investment decision made solely on the advance estimate carries the risk of acting on incomplete information. Disciplined investors treat the advance estimate as one data point within a broader mosaic of leading indicators, rather than a definitive signal requiring immediate action.
According to FINRA’s investor education resources, maintaining a consistent, long-term investment strategy through economic cycles — rather than adjusting allocations reactively based on individual data releases — has historically produced better outcomes for most investors than active economic timing.
What is the difference between real GDP and nominal GDP?
Nominal GDP measures total economic output in current prices without adjusting for inflation. Real GDP adjusts that figure using a price deflator to reflect actual changes in the volume of production. During high-inflation periods, nominal GDP can rise sharply while real GDP stagnates, meaning prices are rising but genuine output is not expanding. Investors focus on real GDP because it provides a more accurate picture of whether the economy is genuinely growing and whether corporate revenues reflect actual volume gains or simply higher prices.
Why does the stock market sometimes rise during a recession?
Stock markets are forward-looking — prices reflect expectations of future earnings, not current conditions. Because markets begin discounting a recession before it is officially confirmed, and begin pricing in recovery before GDP data shows improvement, the S&P 500 often starts recovering while the economy is still contracting. Investors who wait for official GDP confirmation of recovery have typically missed the early and often strongest phase of the market rebound. This pattern repeats across most historical recession and recovery cycles.
How should investors use GDP data when making portfolio decisions?
GDP data works best as context rather than a direct trading signal. Because GDP is a lagging report describing past activity, disciplined investors combine it with leading indicators — the yield curve, PMI readings, and weekly jobless claims — to assess the direction of economic conditions before the GDP report confirms them. GDP cycle awareness can guide sector allocation decisions — shifting toward cyclical holdings during expansion and toward defensive holdings during contraction — but individual stock selection based on business fundamentals remains more reliable than macro timing alone.
This article is for educational purposes only and does not constitute personalized financial or investment advice. All investing involves risk, including the possible loss of principal.