Last updated: July 3, 2026
Every stock quote on platforms like Yahoo Finance, TD Ameritrade, or Charles Schwab displays the 52-week high and low alongside the current price. These two numbers mark the highest and lowest prices a stock traded at during the past 52 calendar weeks — roughly one full year of market activity. For investors building a research process, this annual price range provides immediate context that the current price alone cannot offer.
What the 52-Week High and Low Tell You About a Stock
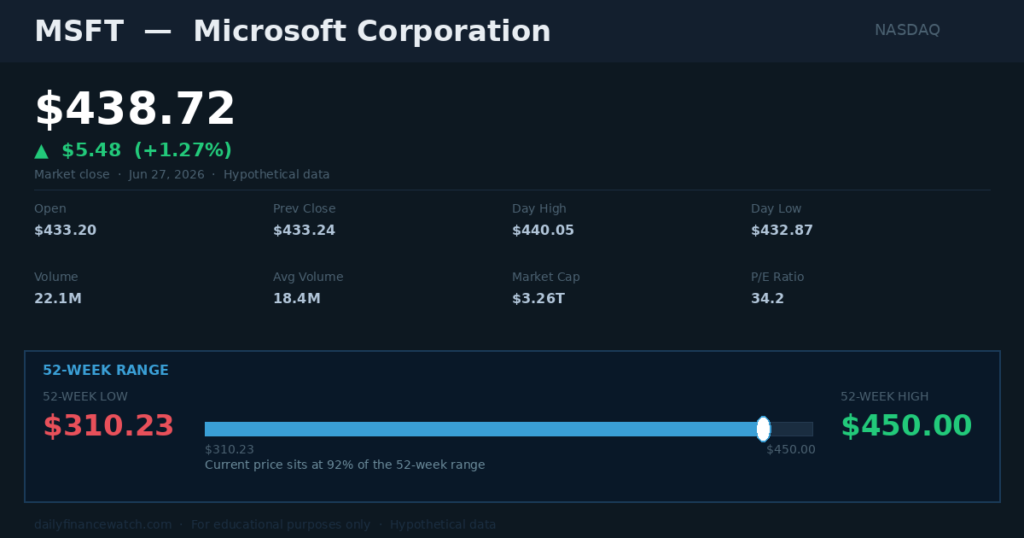
Caption: A typical brokerage quote showing the 52-week range and current price position — all in one view
The 52-week high is the peak price buyers paid during the past year. The 52-week low is the lowest price sellers accepted. Together, they define the stock’s annual trading range — the corridor of prices the market has accepted over the most recent 52 weeks.
This range provides context that a raw share price cannot. A stock priced at $95 means very little without knowing whether it recently traded at $40 or $180. The annual range answers that question immediately.
| Price Position | Range Location | Common Interpretation |
|---|---|---|
| Near 52-week high | Within 5% of peak | Recent buying strength; possible breakout setup |
| Middle of range | 40–60% of range | No clear directional pressure |
| Near 52-week low | Within 5% of trough | Selling pressure; possible undervaluation or distress |
| Breaking above high | New 52-week high | Momentum signal; institutional attention possible |
| Breaking below low | New 52-week low | Possible deterioration; elevated downside risk |
For example, if Microsoft (MSFT) has a 52-week high of $450 and a 52-week low of $310, a current price of $440 places the stock at roughly 97% of its annual range. A price of $320 places it near the bottom. Both positions carry different analytical implications and require different follow-up questions before any investment decision.
How Smart Money Uses the 52-Week High and Low
Institutional investors — including mutual funds, pension funds, and hedge funds — track annual price ranges as part of broader market structure analysis. When a stock approaches or breaks above its 52-week high on expanding trading volume, disciplined investors take note.
Volume expansion at a breakout can suggest institutional participation. Retail buying alone rarely produces the volume spikes that appear when large funds accumulate shares. According to Investor.gov, the SEC’s official investor education resource, understanding how price and volume interact is a foundational part of evaluating market activity.
However, not every breakout above the annual high sustains. Some stocks briefly exceed the 52-week high and reverse within days. A disciplined investor may check whether earnings revisions are trending upward, whether the sector shows relative strength versus the S&P 500, and whether free cash flow supports the valuation implied by the new price. This does not guarantee future returns, but it adds analytical discipline to the decision.
Conversely, a stock near its 52-week low is not automatically a buying opportunity. Some stocks reach annual lows because business fundamentals are deteriorating — falling revenues, rising debt, or shrinking margins. Others reach lows because of temporary market pessimism that does not reflect actual earnings power. Distinguishing between these two situations requires analysis beyond the price range alone.
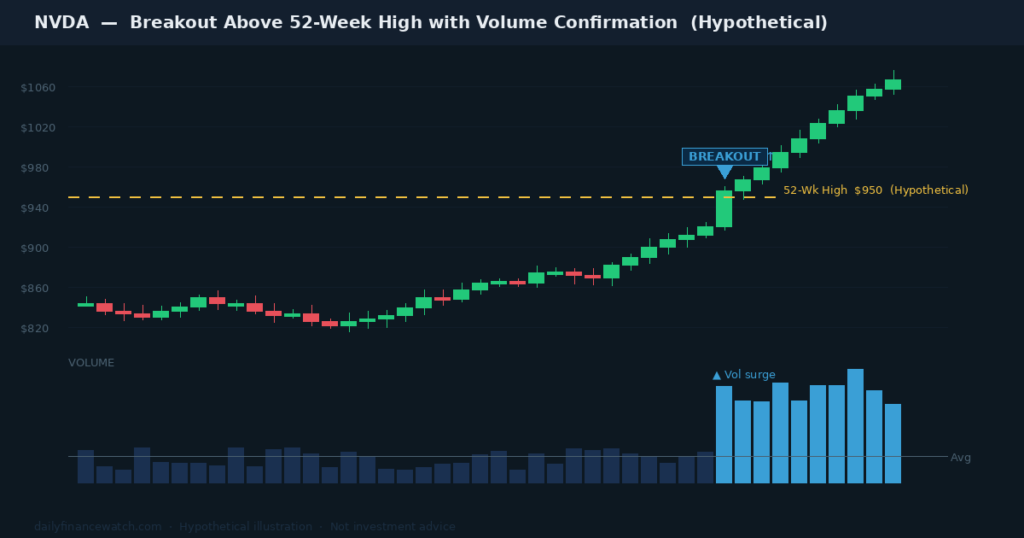
Caption: A hypothetical NVDA chart showing a breakout above the 52-week high confirmed by a surge in trading volume — a pattern institutional investors often monitor.
Common Investor Mistakes Around Annual Price Ranges
Treating the 52-Week High as a Ceiling
Beginner investors sometimes avoid buying stocks near their annual high, assuming the price has already risen too far. This assumption ignores the possibility of continued earnings growth. Microsoft, NVIDIA, and Amazon have each set new 52-week highs dozens of times during prolonged uptrends without immediately reversing. A high price alone is not evidence of overvaluation.
Anchoring to a Previous Price Level
Anchoring is a behavioral finance concept describing the tendency to fixate on a specific reference price and weigh it too heavily in future decisions. An investor who purchased a stock at $150 may anchor to that price when the stock falls to a 52-week low of $90, treating $90 as cheap purely by comparison. However, $90 is only undervalued if the company’s fundamentals support that conclusion — not simply because the price was once higher.
For a broader look at how behavioral biases affect investment decisions, see Investor Psychology and the Stock Market.
Misreading Recency Bias as a Trend Signal
Recency bias is the tendency to assume that recent price trends will continue indefinitely. A stock near its 52-week high does not guarantee further gains, and a stock near its 52-week low does not guarantee further losses. Both extremes reflect what has already happened — not what will happen next. Investors who treat the range as a directional predictor rather than a reference point often make poorly timed decisions.
How to Use the 52-Week High and Low in Your Stock Research
The annual price range appears as a standard field inside every full stock quote on major brokerage platforms. Alongside the current price, trading volume, market capitalization, and price-to-earnings ratio, it forms part of a complete snapshot of where a stock currently stands.
According to FINRA’s investor education materials on reading stock quotes, reviewing the full quote rather than only the current price gives investors a more complete picture of recent price behavior and market participation.
When using the range in a research process, consider three additional factors alongside the raw numbers. Sector context matters: a stock near its annual low in a sector showing broad weakness carries different meaning than an isolated low in an otherwise strong sector. Earnings trend is equally important: a stock falling toward its annual low alongside deteriorating earnings revisions signals fundamentally different risk than one where earnings are still growing. Relative strength is the third factor: comparing the stock’s 12-month return to its benchmark reveals whether underperformance reflects structural problems or a temporary price dip.
A stock near its 52-week high with strong earnings growth, expanding institutional ownership, and sector tailwinds presents a different analytical picture than one near its high for speculative reasons alone. The range is a starting point for analysis, not a conclusion.
For more on evaluating financial health alongside price data, see How to Read a Stock Quote.
Related articles for further reading:
What Is Trading Volume and Why It Matters
Support and Resistance Levels Explained
What does it mean when a stock breaks above its 52-week high?
A breakout above the 52-week high means the stock is trading at a price higher than at any point in the past year. This can signal growing buyer demand and sometimes attracts institutional attention. However, breakouts do not always hold. Investors typically confirm a valid breakout by checking whether the move is supported by above-average volume, improving earnings trends, and favorable sector conditions before committing capital.
Why do some investors look for stocks near their 52-week low?
Stocks near their 52-week low are sometimes undervalued — particularly when a temporary event, rather than a structural business problem, caused the price decline. Value investors may search this zone for overlooked opportunities. However, a falling stock can always fall further. Fundamental analysis of earnings, cash flow, and balance sheet strength remains essential before making any purchase decision based on price proximity to the annual low.
How often does the 52-week high and low update?
Brokerage platforms update the 52-week high and low continuously during market hours. As each trading session closes, the data reflects the most recent 52 calendar weeks of activity. If a closing price sets a new high or low, the displayed range updates immediately. This means the range shifts gradually over time and is always anchored to the current date rather than a fixed calendar year start.
This article is for educational purposes only and does not constitute personalized financial or investment advice. All investing involves risk, including the possible loss of principal.