Last updated: July 3, 2026
Growth stocks and value stocks appear on nearly every beginner investing checklist. Yet most introductions stop at the definition and skip the more useful question: why does the label change — and what does that tell investors about how to interpret it?
What Makes a Stock a Growth Stock
Growth stocks belong to companies that increase revenue or earnings faster than the market average. Investors accept a high price-to-earnings (P/E) ratio for these companies because they expect future profits to justify the premium. Technology and biotechnology companies appear in this category most often.
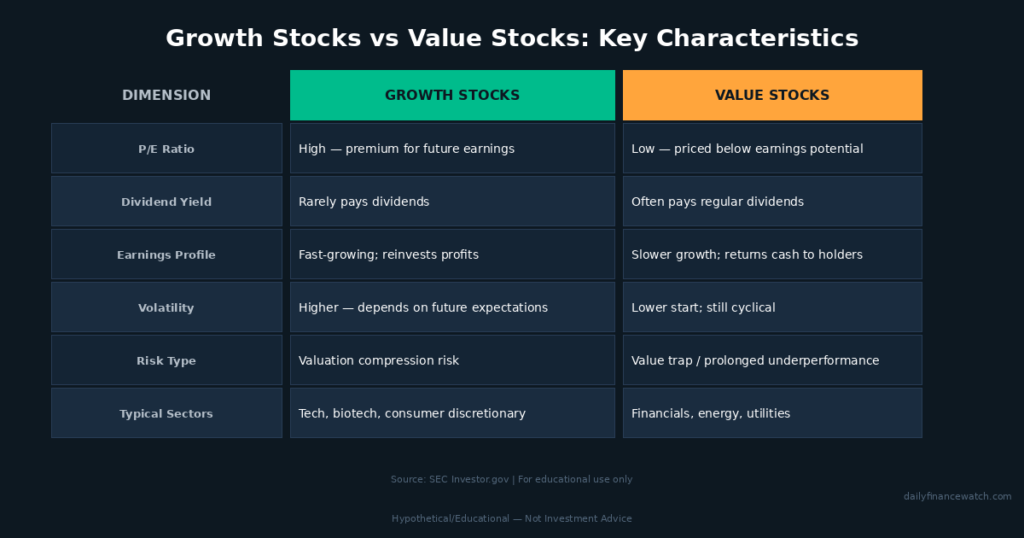
A side-by-side comparison of growth and value stock characteristics across six key investing dimensions.
Growth stocks rarely pay dividends. Instead, companies reinvest earnings to fund expansion. According to the SEC’s investor education resource, growth stocks carry a higher risk of large price swings because their valuations depend on future expectations, not current income. You can review the SEC’s description of stock categories for the official framework.
What Makes a Stock a Value Stock
Value stocks trade at a lower price relative to their fundamentals. Investors measure this with P/E ratios, price-to-book (P/B) ratios, or dividend yield. The core idea is that the market has priced the stock below what its underlying business justifies.
Value investors look for temporary market pessimism, not permanent business failure. A company reporting a weak quarter might see its stock drop sharply, even if its long-term outlook remains intact. That gap between price and perceived fair value defines the value opportunity.
How Analysts Assign the Labels
Index providers classify stocks using quantitative screens, not investor opinions. Russell assigns each stock in the Russell 1000 a growth score and a value score. Stocks with higher price-to-book ratios and stronger forecasted earnings growth land in the growth index. Stocks with lower ratios and slower forecast growth land in the value index. Importantly, partial overlap is permitted — a single stock can carry weight in both indexes simultaneously.
The Cycle That Defines Performance
Neither style wins permanently. Growth stocks dominated the 2010s, fueled by low interest rates and technology sector expansion. Value stocks led from 2001 to 2008 and then again during 2022. According to Morningstar’s April 2024 analysis of Buckingham Wealth Partners data, the Russell 1000 Growth Index returned 17.01% annualized from January 2012 through March 2024, versus 11.52% for the Russell 1000 Value Index over the same period. That gap was not a structural advantage. Rather, it reflected a valuation expansion during a specific interest-rate environment.
Higher interest rates tend to compress growth stock valuations. Growth stocks derive much of their value from projected future cash flows. When rates rise, those future cash flows discount at a higher rate, which pushes valuations down. Value stocks, which carry more of their value in current earnings and dividends, often feel less pressure in rising-rate environments.
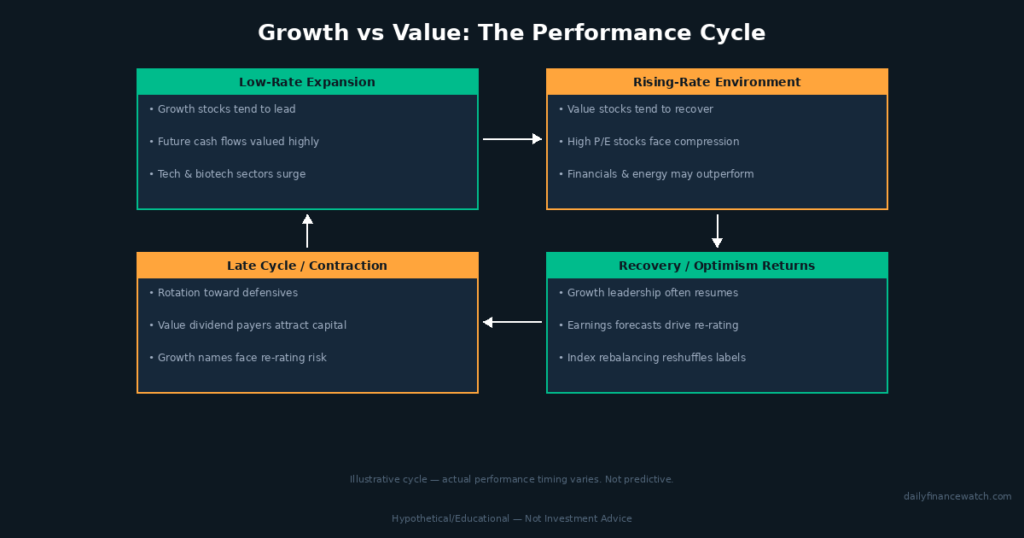
A simplified cycle diagram showing how growth and value leadership alternates across different interest-rate and economic environments.
The Reclassification Problem
This cycle matters more than many beginners realize. S&P removed six of the “Magnificent 7” stocks from the S&P 500 Pure Growth Index in December 2022 after that year’s bear market repriced their valuations. Those same stocks had been considered core growth holdings the year before. The reclassification did not mean those companies changed their business models. Instead, their P/B and P/E ratios shifted enough to disqualify them from the pure growth screen. This is the mechanism behind the thesis: a growth label describes a valuation snapshot, not a permanent identity.
Key Metrics Investors Use to Compare the Two
Three ratios appear most often in growth-vs-value analysis:
Price-to-Earnings (P/E) Ratio: Growth stocks typically carry higher P/E ratios. Value stocks carry lower ones. As of January 2024, the Russell 1000 Growth Index held a P/E of 32.8, which was 36% above its average since 2000, according to Morningstar.
Price-to-Book (P/B) Ratio: This compares a company’s stock price to its net assets. Growth indexes tend to run high here. Value indexes tend to run below long-run averages.
Dividend Yield: Value stocks pay dividends more consistently. Growth stocks typically reinvest earnings instead. Dividend yield is one of the factors Russell uses to assign value scores.
Understanding how these metrics feed into index classifications helps explain why a company’s style designation can shift without its business changing at all. For a deeper look at how price and volume affect the actual mechanics of buying shares, see our guide on bid-ask spreads and market orders.
Risk Profiles Are Not Symmetrical
Growth stocks carry higher volatility by design. Their valuations embed optimism about future earnings, so any disappointment — a missed revenue estimate, a management change, or a sector rotation — can trigger sharp price declines. Value stocks can also decline sharply, but their lower starting valuations provide a partial cushion if earnings disappoint.
Neither profile is safer in an absolute sense. Each carries a different kind of risk at a different stage of the market cycle. FINRA’s guidance on investment risk tolerance frames this clearly: the right level of risk depends on your time horizon and financial goals, not on which style label appears more conservative.
A Note on Style Overlap in Practice
About 30% of stocks in the Russell 1000 Value Index also appear in the Russell 1000 Growth Index, according to Kiplinger’s analysis of FTSE Russell methodology. This overlap means that an investor owning both a growth ETF and a value ETF may hold the same companies in both funds. Style purity is an index construction concept, not a guarantee of clean separation in a real portfolio. Investors building style-tilted portfolios should check the actual holdings of any fund, not just its label.
What Beginners Should Know Before Applying These Labels
Growth and value are useful frameworks for understanding how different companies attract capital. They become less useful when treated as permanent identifiers or as signals to time the market. Sector rotations, index rebalancing schedules, and interest-rate shifts all change which companies fit each label on any given day.
The most important takeaway is mechanical: style classification follows valuation metrics, and valuation metrics change with price. A company that trades at a premium today can shift into value territory after a significant price decline — without a single change to its underlying business. Understanding that connection is more durable than memorizing which style “wins” in a given year.
The Anti-Advice Reminder
Growth and value are descriptive categories, not investment recommendations. Each style has outperformed the other across different multi-year periods, and neither outcome was predictable at the start of those periods. Chasing recent style performance is one of the most documented behavioral errors in investing research. Before applying either label to a specific investment decision, consider your time horizon, tax situation, and existing holdings. A financial professional registered with the SEC or FINRA can help evaluate how any style tilt fits your overall plan.
Understanding these two categories is one building block in a broader framework. From there, exploring how individual orders execute in the market — covered in our article on bid-ask spreads and market orders — shows how price discovery actually works at the transaction level.
This article is for educational purposes only and does not constitute investment advice. All investing involves risk, including the possible loss of principal.
© 2026 Daily Finance Watch. All rights reserved.