Last updated: July 3, 2026
Most investors learn early that market cap measures company size. Fewer realize that a cap tier change — not a business event — can push a stock’s price before earnings move a single dollar.
What Market Cap Actually Measures
Market cap is short for market capitalization. Investors calculate it by multiplying a company’s current share price by its total number of outstanding shares. The result represents the market’s collective estimate of the company’s equity value at that moment.
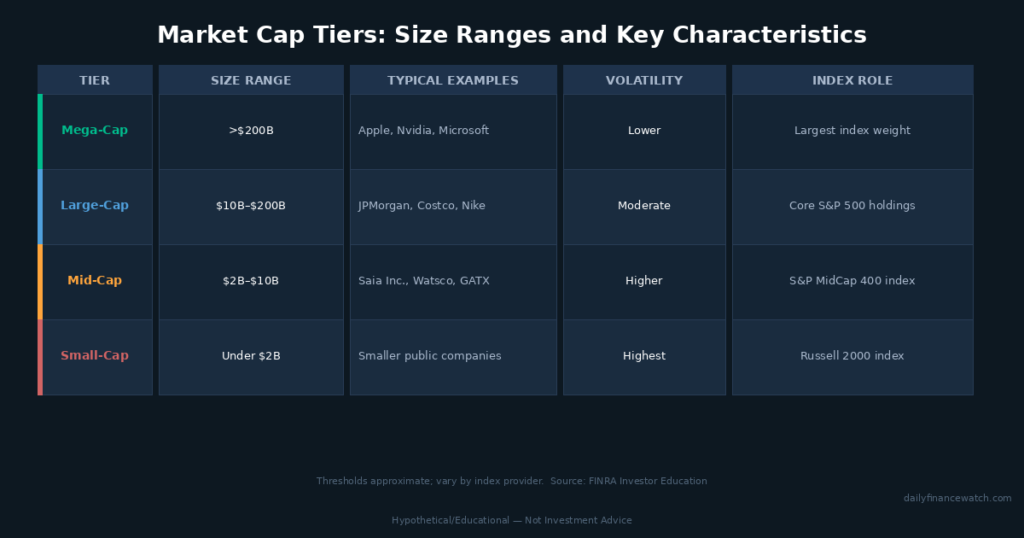
A side-by-side breakdown of the four main market cap tiers with typical size ranges and characteristics.
The SEC’s investor education resource defines market capitalization as the value of a corporation determined by multiplying the current public market price of one share by the number of total outstanding shares. You can review the official definition at Investor.gov. That formula looks simple, but the output changes every time a stock’s price moves — even if the company’s fundamentals stay flat.
The Four Cap Tiers Investors Use
No regulatory body sets permanent thresholds for cap tiers. Instead, index providers and financial professionals apply ranges that shift over time as market prices change. The most common framework today uses four categories.
Mega-cap companies typically exceed $200 billion in market value. These are the largest publicly traded businesses in the U.S. economy. Large-cap companies generally fall between $10 billion and $200 billion. They dominate major indexes like the S&P 500. Mid-cap companies range roughly between $2 billion and $10 billion. Investors often view them as more volatile than large-caps but potentially faster-growing. Small-cap companies typically fall below $2 billion. FINRA notes that these thresholds are not fixed — the numbers can be twice as large in some frameworks depending on the analyst or index provider.
Why the Boundaries Shift
Cap boundaries have drifted upward over decades as overall equity market values expanded. A company that qualified as large-cap in 2000 might classify as mid-cap under today’s frameworks if its price grew more slowly than the broader market. Conversely, some companies that were considered small-cap in 2010 now sit firmly in mid-cap territory without any fundamental change to how they operate.
The Experience Anchor: Nvidia’s Cap Tier Journey
Nvidia’s market cap history illustrates how quickly tier classifications can change. The chipmaker crossed the $1 trillion threshold in late May 2023, as reported by CNBC on May 30, 2023 — driven by AI-related demand for its chips. By February 2024, it had doubled to $2 trillion. Then, on July 10, 2025, Nvidia became the first publicly traded company to reach a $4 trillion market cap, as reported by Al Jazeera. As of July 1, 2026, its market cap stood at approximately $4.85 trillion, according to StockAnalysis.com citing Nasdaq Data Link. Each milestone placed Nvidia in a progressively higher weight within major indexes — without requiring any change to the underlying index methodology.
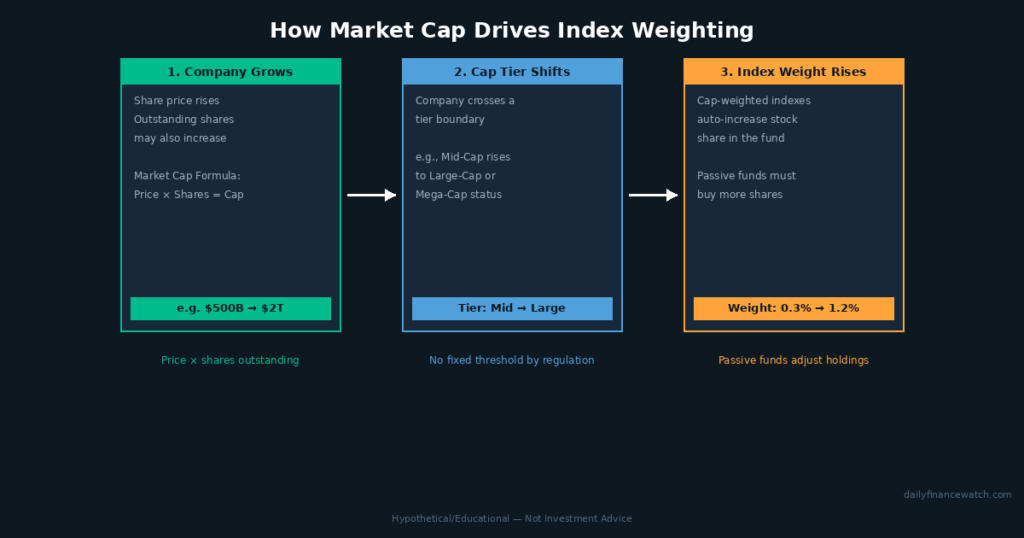
A diagram showing how a company’s rising market cap increases its weight in a cap-weighted index like the S&P 500.
How Market Cap Connects to Index Weighting
Most major U.S. stock indexes weight their holdings by market cap. The S&P 500 assigns each constituent a weight based on its float-adjusted market cap relative to the total float-adjusted cap of all 500 companies. When one company’s market cap grows faster than the rest, its weight in the index increases automatically.
FINRA’s investor education page on market cap explains this dynamic clearly: a higher market cap gives a company a greater share of the overall index value. Importantly, this means investors in S&P 500 index funds automatically hold more of the highest-cap companies without making an active decision. For a deeper look at how order execution works at the transaction level — the actual mechanics that determine a stock’s price in real time — see our guide on bid-ask spreads and market orders.
The Rebalancing Effect on Stock Price
Here is the mechanism that connects cap tiers to price movement. When a company’s market cap grows enough to qualify for inclusion in a major index — or large enough to jump from small-cap to mid-cap in a style index — index fund managers must buy its shares. Passive funds tracking that index own whatever the index holds. As a result, the stock can see buying pressure from index fund purchases that precede any earnings change. The reverse is also true. A company whose cap falls below a threshold faces selling pressure from index funds that must reduce their position. Understanding this dynamic shows why market cap is more than a size label — it’s a mechanism that connects stock price to capital flows.
What Market Cap Does Not Tell You
Market cap does not reflect a company’s debt, cash holdings, or actual profitability. Two companies with identical market caps can carry very different financial profiles. One might hold $50 billion in cash and zero debt. The other might carry $30 billion in debt and minimal reserves. Enterprise value, which adjusts market cap for debt and cash, gives a more complete picture of acquisition cost. However, enterprise value data requires reading financial statements — which is why most headlines use market cap as the quick proxy.
Additionally, market cap reflects only outstanding shares — not how many shares trade on any given day. A company with a large market cap but low daily volume can still be difficult to buy or sell in large quantities. Understanding this is especially relevant for investors reading about bid-ask spreads and market orders, where share liquidity affects the actual execution price.
Why Cap Tier Matters More Than the Dollar Figure
The thesis of this article is worth restating directly. A company crossing a cap tier boundary is a more actionable piece of information than knowing its current dollar value. Tier crossings trigger index rebalancing, which creates systematic buying or selling from passive funds — regardless of whether the business itself changed. Beginners who focus only on the dollar figure miss the downstream effect on capital flows and price discovery.
The Anti-Advice Reminder
Market cap is a useful lens for understanding company size, index composition, and potential liquidity. However, it does not tell you whether a stock is a good investment. A high market cap does not mean a company will grow further. A low market cap does not mean a company is cheap or undervalued. No single metric captures the full picture of an investment’s risk and potential return. Before making decisions based on cap tier or size, consider reviewing your goals and time horizon with a financial professional registered with the SEC or FINRA.
Understanding how market cap connects to index weighting also helps explain why broad index fund investors may find their portfolios more concentrated in a handful of mega-cap names than they expect — a useful starting point for thinking about diversification.
This article is for educational purposes only and does not constitute investment advice. All investing involves risk, including the possible loss of principal.
© 2026 Daily Finance Watch. All rights reserved.