Last updated: June 30, 2026
A beginner researches a company with rising revenue, strong products, and a respected brand, concludes it is a “good company,” and buys the stock. Two years later the business is still excellent, but the stock is down 35%. Nothing went wrong with the company. The investor paid a price that already assumed years of perfect growth. This is the trap at the center of beginner stock analysis: a great company and a great investment are not the same thing, and the gap between them is price.
What Stock Analysis Is Really Measuring
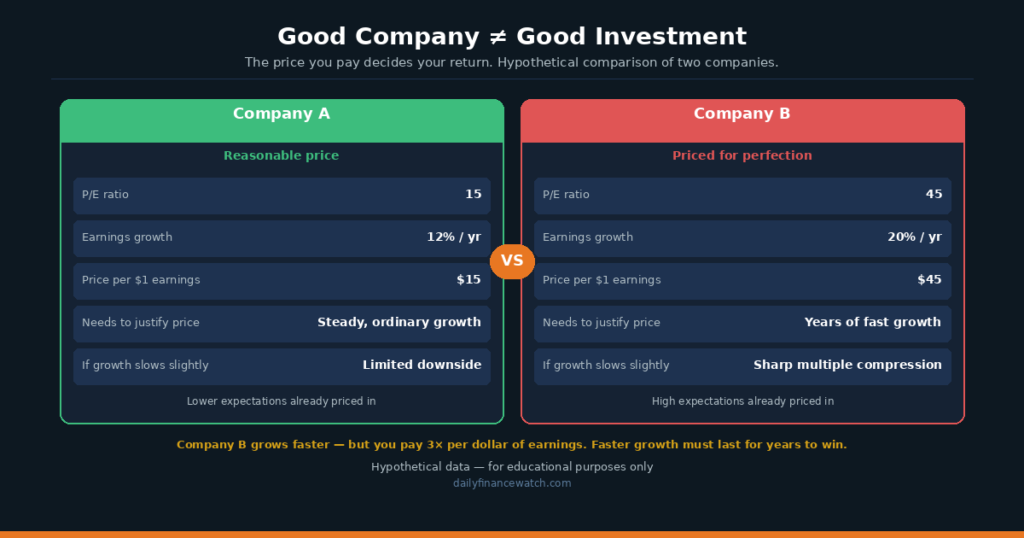
Caption: Analysis weighs business quality against the price you pay — a strong company bought too expensively can still lose money.
Stock analysis is the process of evaluating whether a company’s shares are worth their current price. The phrase “worth their current price” is the part beginners skip. Analysis is not a quality contest where the best business wins. It is a value judgment that compares what you receive — a claim on future earnings — against what you pay today.
Analysts use two broad approaches. Fundamental analysis examines the business itself: revenue, profit, debt, and competitive position. Technical analysis studies price and volume patterns instead. For long-term beginners, fundamental analysis matters more, because it connects the stock to the underlying business rather than to short-term price movement.
Why “Good Company” Is the Wrong Starting Point
The most common beginner error is treating analysis as company evaluation alone. A company can be excellent and its stock can still be a poor investment, because the market may have already priced in that excellence and more. When expectations built into the price exceed what the company delivers, the stock falls even as the business grows. Professional investors call this paying too high a multiple. Therefore, the first question is not “is this a good company” but “is this a good company at this price.”
| What Beginners Judge | What Analysis Should Judge |
|---|---|
| Is the product popular? | Is the price justified by earnings? |
| Is the brand well-known? | What growth is already priced in? |
| Is revenue growing? | Is growth faster than the valuation assumes? |
| Do I like the company? | What return does the current price imply? |
The Core Numbers Beginners Should Understand
Fundamental analysis rests on a handful of figures found in a company’s financial statements, which public U.S. companies must file with the Securities and Exchange Commission. You can access these filings directly through the SEC’s EDGAR database, which holds every quarterly and annual report at no cost.
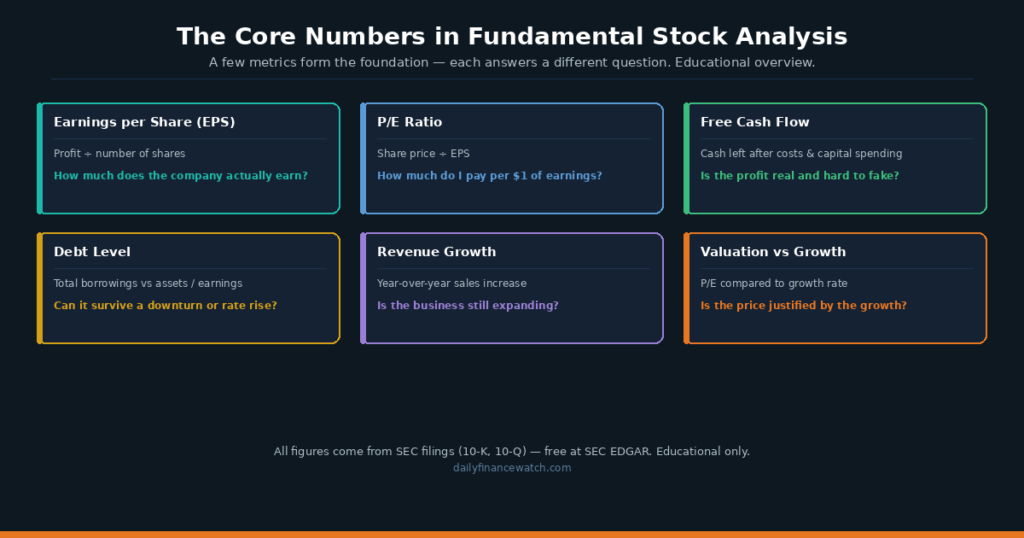
Caption: A few core metrics — earnings, free cash flow, debt, and valuation ratios — form the foundation of fundamental analysis.
Earnings per share (EPS) measures profit divided by the number of shares. The price-to-earnings ratio (P/E) divides the share price by EPS, showing how much investors pay for each dollar of earnings. A high P/E means the market expects strong future growth; a low P/E suggests modest expectations. Crucially, a high P/E is neither good nor bad on its own — it is only meaningful compared to the company’s actual growth rate.
Free cash flow — the cash a business generates after operating costs and capital spending — often reveals more than reported earnings, because it is harder to manipulate with accounting choices. A company can report rising earnings while free cash flow stagnates, which is a warning sign disciplined investors watch. Debt levels matter too: a company carrying heavy debt has less flexibility during downturns and higher risk if interest rates rise.
A Realistic Example With Hypothetical Numbers
Consider two hypothetical companies. Company A trades at a P/E of 15 and grows earnings 12% per year. Company B trades at a P/E of 45 and grows earnings 20% per year. Company B grows faster, yet an investor pays three times as much per dollar of earnings. For Company B to reward investors, it must sustain that high growth for years. If growth slows even modestly, the high P/E can compress sharply, producing losses despite continued business growth. Company A needs only steady, unremarkable performance to justify its lower price. This comparison shows why price relative to growth — not growth alone — drives the analysis.
How Valuation and Price Work Together
Most guides describe stock analysis as “research the company’s fundamentals.” This framing is incomplete in a specific way. It implies that strong fundamentals lead to good returns, when in fact returns depend on fundamentals relative to the price already paid. Institutional investors think in terms of expectations embedded in price — they ask what growth the current valuation assumes, then judge whether the company can exceed it. A stock rises most when a company beats already-priced-in expectations, not simply when it performs well.
This reframing explains a pattern that confuses beginners: why a company can report strong earnings and still see its stock fall. If the market expected even stronger results, “strong” becomes a disappointment relative to the price. The number that moved was expectations, not quality.
Common Mistakes in Beginner Stock Analysis
Anchoring is a frequent error. An investor fixates on a stock’s past high price and concludes it is “cheap” when it falls below that level, ignoring whether the original price was ever justified. The past price is not a measure of value. Recency bias compounds this: after a stock rises for months, beginners extrapolate the trend indefinitely and pay prices that assume the climb never ends.
Confirmation bias also distorts analysis. Once an investor likes a company, they tend to seek information that supports buying and dismiss warning signs. Disciplined analysis deliberately looks for reasons not to buy — weak free cash flow, rising debt, or a valuation that already prices in perfection.
For investors building this foundation, how to start investing in stocks covers the practical setup, and fundamental vs technical analysis explains the two analytical approaches in greater depth.
What Disciplined Investors Actually Examine
Smart money analysis combines business quality with valuation discipline rather than treating them separately. Disciplined investors assess competitive position — whether a company can defend its profits from competitors — alongside free cash flow quality and balance sheet strength. They then compare these strengths against the price. A wonderful business at an unreasonable price is set aside, not bought, because the price already reflects the quality.
A disciplined investor may also track how a company’s valuation compares to its own history and to peers as of a stated date. When a stock trades far above its historical average P/E without faster earnings growth to justify it, experienced investors often grow cautious rather than enthusiastic. This does not guarantee future returns, but it reflects valuation discipline rather than momentum chasing. Megatrends such as artificial intelligence can justify higher valuations when growth genuinely accelerates, yet disciplined investors still ask whether the current price already assumes that growth.
What you should now understand differently is the purpose of analysis itself. You are not searching for good companies — good companies are easy to find and usually expensive. You are searching for a gap between a company’s value and its price. Analysis succeeds when it tells you not just whether a business is strong, but whether the price gives you a reasonable claim on that strength. The company quality was never the answer; the relationship between value and price always was.
FAQ
What is the most important thing to look at when analyzing a stock?
No single metric matters in isolation. The most important relationship is between a company’s growth and the price you pay, often expressed through the P/E ratio compared to the earnings growth rate. A strong company can be a poor investment if its price already assumes years of perfect growth. Beginners should also check free cash flow and debt levels, because these reveal financial health that reported earnings alone can hide.
Why does a stock fall even after the company reports strong earnings?
Stock prices reflect expectations, not just results. If the market already expected strong earnings and priced them in, merely strong results can disappoint relative to that expectation, causing the stock to fall. This is why analysis must consider what growth a stock’s price already assumes. A company beating already-high expectations tends to rise; a company meeting high expectations may fall, because the good news was priced in before the report.
How do beginners find a company’s financial information?
Public U.S. companies must file financial reports with the Securities and Exchange Commission. Beginners can access every quarterly report (10-Q) and annual report (10-K) for free through the SEC’s EDGAR database. Many brokerage platforms also summarize key metrics like P/E ratio, earnings, and free cash flow. Starting with official SEC filings ensures the information is accurate and complete rather than filtered through promotional sources.
This content is for educational purposes only and does not constitute personalized financial advice. All investing involves risk, including the possible loss of principal.