Every weekday at 4:00 p.m. Eastern Time, three numbers flash across financial news screens around the world. The S&P 500, the Dow Jones Industrial Average, and the Nasdaq Composite close for the day, and analysts immediately begin explaining what those numbers mean. Understanding the S&P 500, Dow Jones, and Nasdaq index trio is one of the most practical things a beginning investor can learn. Each index measures a different slice of the U.S. stock market. Each uses a different calculation method. Moreover, each responds differently to the same economic event — and that difference matters when you are deciding where to invest.
What Is a Stock Market Index and Why It Matters
A stock market index is a calculated number that tracks the combined performance of a selected group of stocks. The index does not hold any money or own any shares. Instead, it functions as a benchmark — a reference point against which investors measure their own results. For example, if your portfolio gained 8% in a year while the S&P 500 gained 12%, your portfolio underperformed the market benchmark by 4 percentage points.
Indexes matter for three practical reasons. First, they allow investors to compare their own returns against a standard. Second, they signal how broad sectors of the economy are performing. Third, they serve as the target for index funds and ETFs. An index fund is an investment fund that buys all the stocks in a specific index in the same proportions, aiming to match — not beat — the index’s returns.
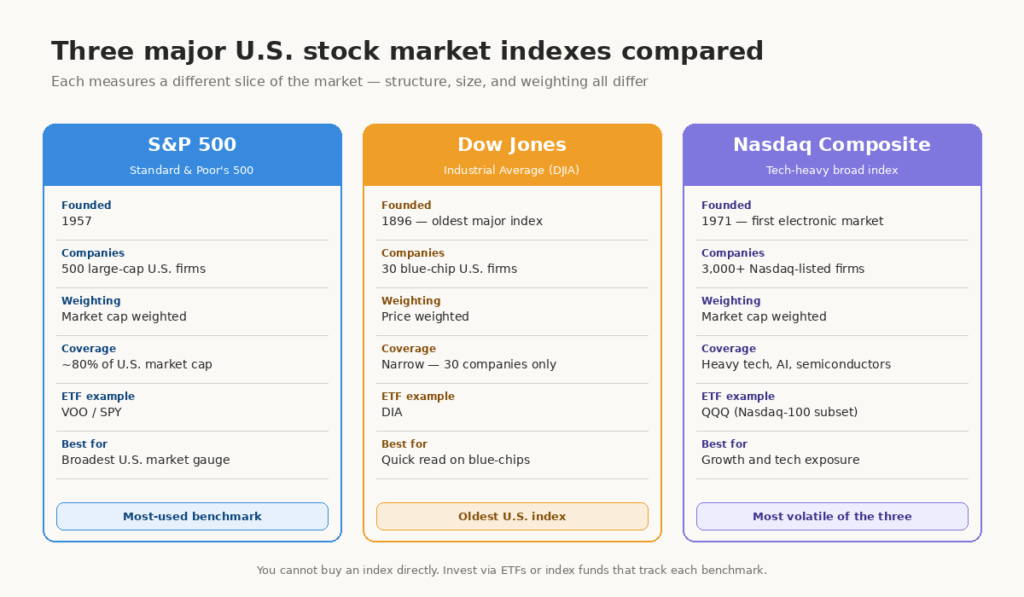
| Index | Tracks | Calculation method | Founded |
|---|---|---|---|
| S&P 500 | 500 large U.S. companies | Market cap weighted | 1957 |
| Dow Jones | 30 blue-chip U.S. companies | Price weighted | 1896 |
| Nasdaq Composite | 3,000+ Nasdaq-listed companies | Market cap weighted | 1971 |
You can review index definitions and investor education resources at the SEC’s investor education portal.
S&P 500, Dow Jones, and Nasdaq Index: How Each One Works
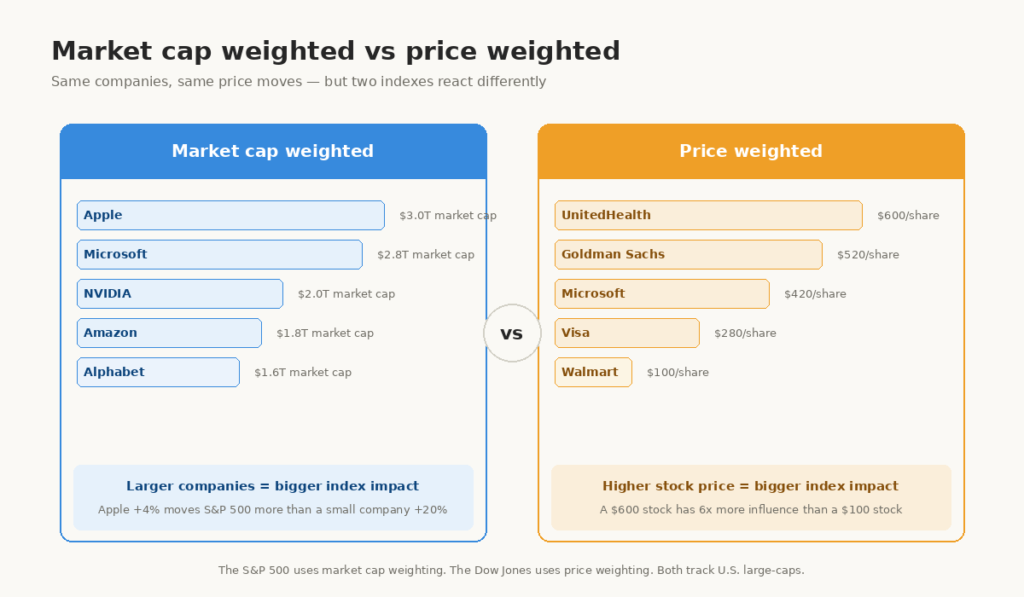
The S&P 500 is the most widely used benchmark for U.S. stock market performance. It tracks the stock performance of 500 leading companies listed on stock exchanges in the United States and includes approximately 80% of the total market capitalization of U.S. public companies, with an aggregate market cap of more than $61.1 trillion as of December 31, 2025. The index is market capitalization weighted. This means larger companies carry proportionally more influence over the index’s daily movement than smaller ones. Google Finance
The Dow Jones Industrial Average is a price-weighted index, meaning that the companies with the highest stock prices have the most influence on the index, regardless of their valuations. The Dow only lists 30 companies. This price-weighting method is the key distinction that makes the Dow behave differently from the S&P 500 on any given day. Created in 1896 by Charles Dow and Edward Jones, it originally tracked just 12 industrial companies. Today, it includes 30 large blue-chip companies chosen for their sector significance and overall relevance to the U.S. economy. The Motley FoolChase
The Nasdaq Composite takes a different approach entirely. Nasdaq began in 1971 as the first fully electronic stock market, displaying bid and ask prices from competing market makers on electronic terminals. Its composite index tracks nearly every company listed on the Nasdaq exchange, making it heavily concentrated in technology, artificial intelligence, and growth companies. Furthermore, the Nasdaq-100 — a subset of the Composite — tracks the 100 largest non-financial companies on the exchange and serves as the basis for popular ETFs like QQQ. Wikipedia
A Simple Example With Real Numbers
Imagine three investors each watching a different index on the same day. Apple reports strong earnings and its stock rises 4%. Because Apple carries a large weight in both the S&P 500 and the Nasdaq Composite, both indexes climb noticeably. However, Apple is also in the Dow Jones, but because the Dow is price-weighted rather than market-cap weighted, Apple’s actual dollar price change — not its market value — determines its impact on the Dow. This means the same news event can produce different index moves on the same afternoon. Disciplined investors watch all three rather than relying on one alone.
How to Actually Invest in These Indexes
You cannot buy shares of an index directly. An index is a measurement, not a product. However, you can buy shares of index funds and ETFs that track each one closely. You can invest in the S&P 500 index by purchasing shares of a mutual fund or exchange-traded fund that passively tracks the index. These investment vehicles own all the stocks in the S&P 500 index in proportion to their weights. The Motley Fool
The three most widely discussed ETFs for beginning investors are SPY and VOO for the S&P 500, DIA for the Dow Jones, and QQQ for the Nasdaq-100. VOO, the Vanguard S&P 500 ETF, carries one of the lowest expense ratios available — approximately 0.03%. An expense ratio is the annual fee charged by a fund as a percentage of assets under management. Over decades, a low expense ratio makes a meaningful difference in compounded returns.
Since its launch in 1957, the S&P 500 has posted an average return of about 10.6% a year. This does not mean that the S&P 500 reliably provides returns of 10.6% every year. Stock market performance is unpredictable, and some years are much better than others. These historical figures do not guarantee future results. However, they explain why Warren Buffett has publicly recommended a low-cost S&P 500 index fund as a suitable long-term investment for most people. Fidelity
Our guide on what is the stock market explains how exchanges and price discovery work beneath these indexes.
What Smart Investors Watch Across All Three Indexes
Experienced investors use the three indexes together as a diagnostic tool rather than as separate scorecards. When the S&P 500 and the Dow Jones rise together while the Nasdaq falls, this often signals sector rotation — institutional capital moving away from technology and toward industrial or financial stocks. Sector rotation means large funds shift money between market sectors based on economic conditions, valuation, and earnings expectations.
In a comparative study between the Nasdaq 100 and the S&P 500, the Nasdaq 100 outperformed the S&P 500 every year from 2007 to 2025, posting a total average return of 17.1% compared to the S&P 500 return of 12.2%. A notable exception was 2022 when the Nasdaq 100 underperformed relative to the S&P 500 by 14.3%. This divergence illustrates why technology-heavy positioning carries more volatility, not just more return potential. Chase
Smart money flow analysis often begins by comparing how all three indexes behave on high-volume days. When the Nasdaq rises sharply on expanding volume while the Dow lags, institutional interest in artificial intelligence and semiconductor megatrends may be increasing. This does not guarantee future returns, but it helps disciplined investors identify where capital is concentrating.
Investor psychology also shapes index behavior. During market euphoria, the Nasdaq often rises fastest as retail investors chase growth stocks. Recency bias — the tendency to expect recent price patterns to continue — drives heavy buying near market peaks. A valuation-disciplined investor compares current index price-to-earnings ratios against historical averages before adding capital, rather than buying simply because an index hit a new high.
For further reading, explore these related guides:
What is the difference between the S&P 500 and the Dow Jones?
The S&P 500 tracks 500 large U.S. companies using market capitalization weighting, meaning larger companies have more influence. The Dow Jones tracks only 30 companies using price weighting, meaning higher-priced stocks carry more influence regardless of company size. The S&P 500 is generally considered the more reliable broad market indicator because it covers a wider range of companies across all major sectors. Both indexes are published by S&P Dow Jones Indices.
Can a beginner invest directly in the S&P 500 or the Dow Jones?
You cannot buy an index directly because it is a measurement, not a product. However, you can buy ETFs or mutual funds that track each index closely. VOO and SPY track the S&P 500, DIA tracks the Dow Jones, and QQQ tracks the Nasdaq-100. These funds are available through any standard brokerage account. Many have no minimum investment requirement and charge very low annual fees, making them accessible for beginning investors.
Why does the Nasdaq fall harder than the S&P 500 when interest rates rise?
The Nasdaq is concentrated in technology and growth companies whose valuations depend heavily on future earnings. When interest rates rise, the present value of those future earnings declines mathematically, because money today is worth more relative to money in the future. Therefore, growth stocks lose value faster than established dividend-paying stocks when rates increase. This explains why the Nasdaq-heavy portfolio fell sharply in 2022 when the Federal Reserve raised rates aggressively.