Last updated: July 6, 2026
The S&P 500 has experienced a market correction — a decline of 10% or more from a recent peak — roughly once every 1.5 years on average, based on historical data. Most of these corrections resolve without becoming bear markets. Yet every time one begins, many investors treat it as the start of a permanent collapse. Understanding what a correction actually is, what typically drives it, and how it differs from a bear market removes much of the emotional weight that causes investors to make costly decisions at exactly the wrong moment.
What a Market Correction Is and How It Is Defined
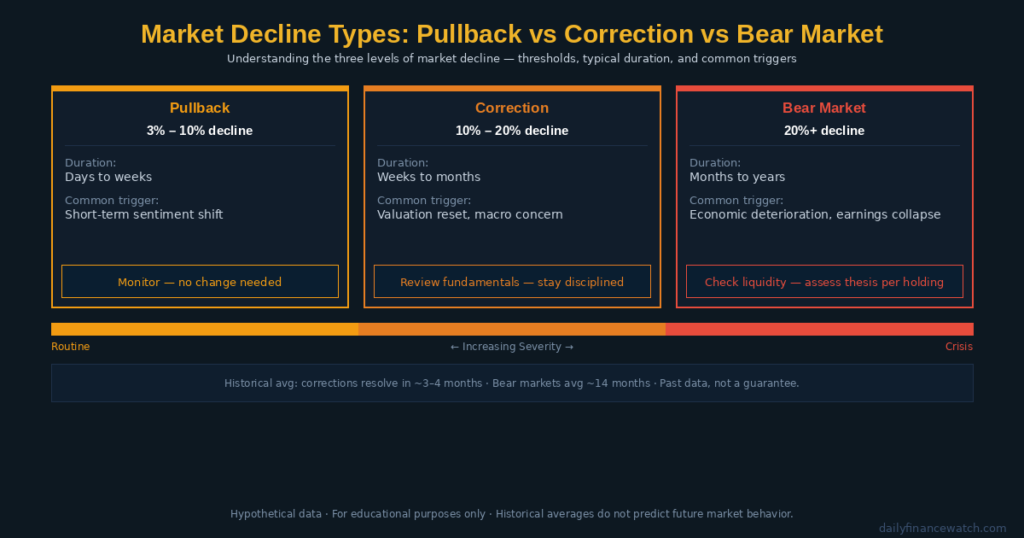
Caption: A market correction spans the 10%–20% decline zone — below a routine pullback, above the bear market threshold.
A market correction is a decline of at least 10% from a recent high in a major index, most commonly the S&P 500. The 10% level is the conventional dividing line between a routine pullback and a correction. A further decline beyond 20% crosses into bear market territory. Corrections sit between those two thresholds: deeper than noise, but not yet a fundamental breakdown.
| Market Decline Type | Threshold | Typical Duration | Common Trigger |
|---|---|---|---|
| Pullback | 3%–10% drop | Days to weeks | Short-term sentiment shift |
| Correction | 10%–20% drop | Weeks to months | Valuation reset, macro concern |
| Bear Market | 20%+ drop | Months to years | Economic deterioration, earnings collapse |
These ranges reflect historical convention and do not predict how long any specific decline will last. According to Investor.gov, the SEC’s official investor education resource, price declines are a normal feature of equity markets and do not indicate permanent impairment of a diversified portfolio.
How a Correction Differs From a Bear Market
The key distinction is not just magnitude — it is cause and duration. A correction most often reflects a valuation reset, where prices had risen faster than underlying earnings justified. When valuations stretch, even modestly negative news can trigger a sharp pullback as investors reprice expectations. Bear markets, by contrast, typically require genuine economic deterioration: falling corporate earnings, rising unemployment, or a credit contraction that reduces the actual productive capacity of businesses.
Corrections also resolve faster. Historically, the average market correction has lasted approximately three to four months before prices recovered to prior highs. Bear markets have historically taken significantly longer, depending on the severity of the underlying economic damage. These are historical averages and do not indicate future outcomes.
What Causes a Market Correction to Begin
Several conditions frequently precede corrections. None guarantees one will occur, but disciplined investors track these signals to calibrate risk exposure before a decline accelerates.
Stretched valuations are the most common precondition. When the price-to-earnings (P/E) ratio — which measures how much investors pay per dollar of earnings — climbs well above its historical average, the market becomes sensitive to any negative surprise. A hypothetical example: if the S&P 500 trades at a P/E of 28 when its long-run average is closer to 17, even a modest earnings miss can trigger a significant repricing. This does not mean a correction is imminent, but the margin for error narrows.
Interest rate increases reduce the present value of future corporate earnings. When the Federal Reserve raises rates, investors discount future earnings at a higher rate, which lowers the fair value of growth stocks in particular. Technology and high-growth companies — whose value depends heavily on earnings expected years into the future — tend to fall more sharply during rate-driven corrections than value or dividend-paying stocks.
Macro data disappointments — weaker-than-expected employment figures, a surprise inflation reading, or a GDP revision — can shift market sentiment quickly. Institutional investors adjust positioning based on these data points, and large simultaneous moves by major funds amplify the price decline.
Geopolitical shocks compress decision-making time for institutional investors and elevate uncertainty, which alone increases the cost of holding risk assets. The result is often a rapid short-term correction that reverses once the initial shock is absorbed.
The Role of Investor Psychology During a Correction
Two behavioral patterns make corrections more damaging than they need to be. Panic selling — rapidly exiting positions in response to falling prices — locks in losses and removes the investor from the subsequent recovery. Loss aversion, the behavioral finance concept describing the tendency to feel losses roughly twice as intensely as equivalent gains, makes panic selling feel rational in the moment even when it destroys long-term value.
Furthermore, recency bias — the tendency to project recent price trends into the future — causes investors to assume a falling market will keep falling indefinitely. However, corrections are defined by their tendency to reverse. An investor who sells into a correction and waits for certainty before re-entering often misses the fastest recovery days, which frequently arrive without warning.
How Long Market Corrections Typically Last
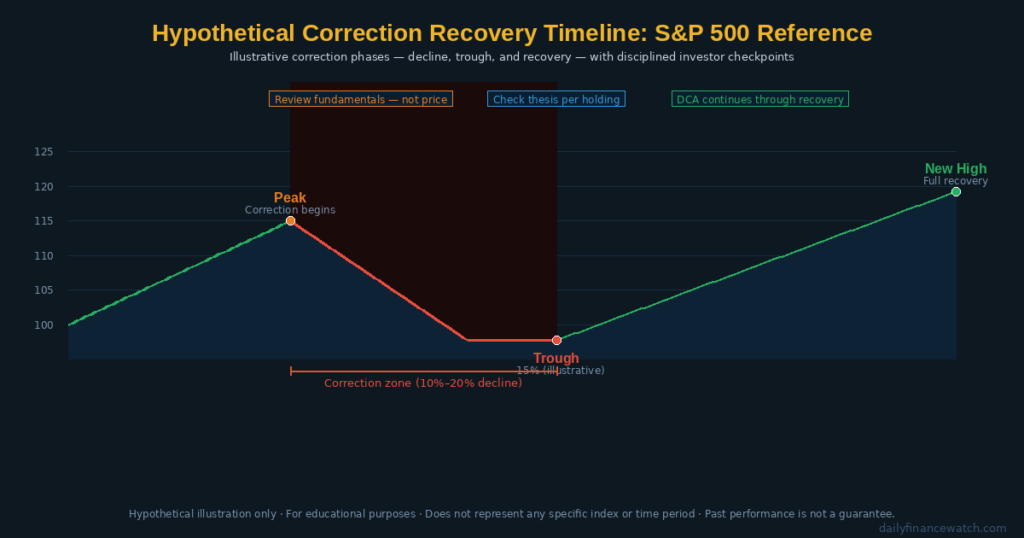
Caption: Corrections have historically resolved in weeks to months — far shorter than the bear markets investors often fear they signal.
The speed of recovery from a correction depends primarily on its cause. Sentiment-driven corrections — where prices fell because of fear rather than deteriorating fundamentals — tend to recover quickly once the triggering uncertainty resolves. Corrections caused by genuine earnings disappointment or policy shifts may take longer, as the underlying issue must actually improve rather than simply stabilize.
Historically, the S&P 500 has recovered from corrections within three to six months in most cases, though individual cycles vary significantly. These reference points are cited for educational context only.
A disciplined investor may watch two signals during a correction to assess whether recovery is beginning. First, volume behavior: if selling volume declines as prices stabilize, institutional selling pressure may be exhausting itself. Second, breadth improvement: if more stocks within an index begin rising than falling — even before the index itself recovers — this can indicate that institutional buying is returning to the market. Neither signal guarantees a recovery, but both provide context that pure price observation does not.
For more on how corrections fit within the broader market cycle, see what bull and bear market cycles mean for your returns.
How Disciplined Investors Use Corrections to Their Advantage
Corrections are the period when disciplined, long-term investors most clearly separate themselves from reactive, short-term ones. The behavioral pressure to sell is highest precisely when selling is most likely to be counterproductive.
Reviewing Position Quality, Not Reacting to Price
The most productive response to a correction is a fundamental review of each holding — not a price-driven exit. A disciplined investor asks: Has the investment thesis changed? Is revenue still growing? Is the balance sheet still strong? Is free cash flow still positive? If the answers remain favorable, a lower price represents a better entry point, not a reason to exit.
For example, a hypothetical investor holding Microsoft at $380 per share watches the stock fall to $330 during a broad market correction. The company’s earnings trend, cash position, and revenue growth remain intact. The decline reflects market-wide sentiment, not Microsoft-specific deterioration. A disciplined investor may view this as an opportunity to assess whether adding to the position makes sense relative to their portfolio’s overall risk exposure. This does not guarantee the stock will recover to any specific price.
Dollar-Cost Averaging Through a Correction
Investors who use dollar-cost averaging — contributing fixed amounts at regular intervals regardless of price — automatically purchase more shares during corrections when prices are lower. This reduces the average cost per share over time without requiring any prediction of when the correction will end. For example, a hypothetical investor contributing $500 per month to an S&P 500 index fund like SPY accumulates more units during a correction than during a bull run at the same contribution level. This does not eliminate risk, but it removes the pressure of market timing.
Checking Valuations Before Adding Exposure
Corrections sometimes bring valuations back to more reasonable levels. A disciplined investor may compare the current P/E ratio of the market or a specific stock to its historical average before deciding whether to increase exposure. A correction that brings the S&P 500 P/E from 28 back to 20 meaningfully changes the risk-reward profile, even if the immediate outlook remains uncertain. This analysis does not predict the bottom, but it anchors decisions in valuation rather than emotion.
For more on how volatility drives short-term price swings within corrections, see what stock volatility means for your portfolio.
What is the difference between a market correction and a bear market?
A market correction is a decline of 10%–20% from a recent high. A bear market begins when the decline exceeds 20%. The difference is not only magnitude — corrections typically reflect valuation resets or temporary sentiment shifts, while bear markets usually require genuine economic deterioration. Corrections resolve faster, often within weeks to a few months. Bear markets typically last longer and require actual improvement in economic or earnings conditions before prices recover.
How often do stock market corrections happen?
Based on historical S&P 500 data, market corrections have occurred roughly once every one to two years on average. Most corrections do not develop into bear markets. They are a normal feature of equity markets rather than a sign of structural breakdown. Investors who hold diversified, long-term portfolios experience multiple corrections over a typical investing lifetime without suffering permanent capital loss, provided they maintain positions through the decline.
Should investors buy stocks during a market correction?
Adding to positions during a correction can reduce the average cost per share and improve long-term returns — but only when the investor’s existing emergency reserves are intact, the underlying investment thesis for each holding remains sound, and the purchase fits within a consistent, pre-planned strategy. Buying during a correction purely because prices are lower, without reviewing fundamentals, is not a disciplined approach. Investors should never invest capital they cannot afford to leave invested for at least several years.
This article is for educational purposes only and does not constitute personalized financial or investment advice. All investing involves risk, including the possible loss of principal.