Last updated: July 6, 2026
Dividend investing is one of the most practical ways to generate regular income from stocks without selling a single share. When Apple distributes $0.25 per share every quarter, shareholders receive that cash simply for owning the stock. For beginners building long-term wealth, understanding dividend investing — how payments work, how to evaluate yield, and how to avoid common mistakes — is a foundational skill.
How Dividend Investing Works Step by Step
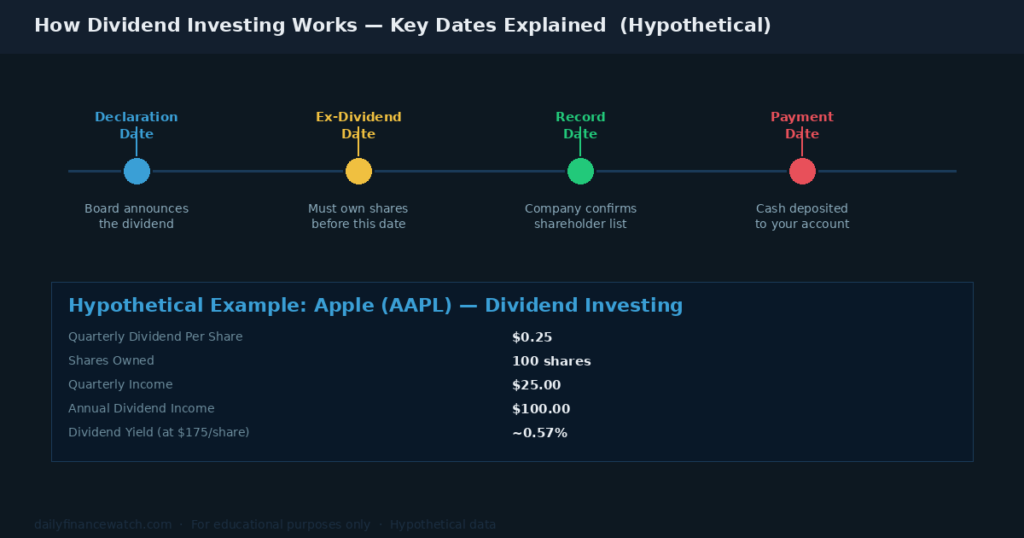
Caption: The four dates every dividend investor must know, with a hypothetical Apple example showing how quarterly payments add up annually.
A dividend is a portion of company profits distributed directly to shareholders. The board of directors decides the amount and frequency. Most U.S. companies pay quarterly, though some pay monthly or annually.
Four dates govern every payment:
| Date | What Happens | Why It Matters |
|---|---|---|
| Declaration Date | Board announces the dividend | Sets the amount and schedule |
| Ex-Dividend Date | Eligibility cutoff for buyers | Must own shares before this date |
| Record Date | Company confirms shareholder list | Typically one day after ex-dividend |
| Payment Date | Cash deposited to your account | When income actually arrives |
The ex-dividend date is the most critical for dividend investing. Investors who purchase shares on or after that date do not receive the upcoming payment. Furthermore, stock prices often fall by approximately the dividend amount on that date, as cash leaves the company.
Consider a hypothetical example with Apple (AAPL): a $0.25 quarterly dividend on 100 shares produces $25.00 per quarter — $100.00 annually. At a hypothetical share price of $175, this produces a dividend yield of approximately 0.57%. Yield is the annual dividend divided by the current share price, expressed as a percentage.
Why Dividend Investing Builds Wealth Over Time
The most powerful feature of income investing is reinvestment. A Dividend Reinvestment Plan, or DRIP, automatically uses each payment to purchase additional shares. Those additional shares then generate their own dividends, creating a compounding cycle.
A hypothetical $10,000 investment growing at 6% annually reaches roughly $32,000 over 20 years through price appreciation alone. However, the same investment with a 3% dividend yield fully reinvested reaches approximately $56,000 over the same period — a gap of nearly $24,000 from compounding alone. This does not guarantee future returns, but it illustrates why reinvestment is central to long-term dividend investing strategy.
According to Investor.gov, the SEC’s official investor education resource, dividend income has historically contributed a meaningful share of total stock market returns over long periods. However, no dividend is ever guaranteed — companies can reduce or eliminate payments at any time.
Common Dividend Investing Mistakes to Avoid
Chasing the Highest Dividend Yield
A high yield is not always a sign of a healthy company. When a stock price falls sharply, the yield rises automatically — even if the payment has not increased. This situation is sometimes called a yield trap. An investor who buys solely because the yield looks attractive may be purchasing a deteriorating business.
For instance, a stock paying $2.00 annually that falls from $40 to $20 now shows a 10% yield. That figure is mathematically accurate but potentially misleading if earnings are declining. Disciplined investors examine the payout ratio — the percentage of earnings paid as dividends — alongside free cash flow before trusting any yield figure. A payout ratio above 80% may signal limited room to sustain the payment. In contrast, a ratio below 50% generally suggests greater financial flexibility.
Ignoring the Ex-Dividend Date
Beginner investors sometimes purchase shares the day after the ex-dividend date, expecting to receive the upcoming payment. Because they bought too late, they receive nothing. Meanwhile, the stock price has already adjusted downward to reflect the cash leaving the company. Timing purchases without understanding this mechanism can lead to unexpected short-term losses.
For more on reading key financial metrics alongside dividend data, see How to Read a Stock Quote.
What Smart Money Watches in Dividend Stocks
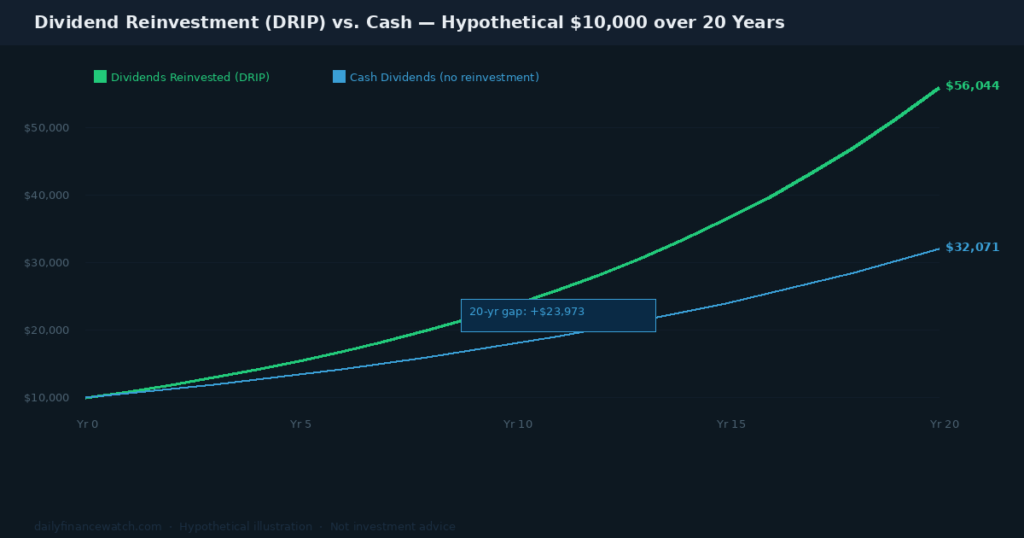
Caption: Reinvesting dividends versus taking cash — a hypothetical $10,000 comparison over 20 years showing how compounding creates a significant long-term gap.
Institutional investors evaluate several factors before committing capital through dividend investing. Free cash flow quality matters more than reported earnings, because dividends are paid with cash — not accounting profits. A business reporting strong earnings but weak free cash flow may struggle to sustain its payment during downturns.
Earnings revision trends provide additional signals. When analysts consistently revise estimates upward, dividend sustainability rises. Downward revisions may indicate pressure ahead. Sector context also matters: defensive sectors such as consumer staples, utilities, and healthcare have historically maintained dividends through economic slowdowns, while cyclical sectors tend to cut payments when revenues fall.
According to FINRA’s investor resources on dividend basics, investors should also consider tax treatment. The IRS taxes qualified dividends — most payments from U.S. corporations held for the required period — at lower capital gains rates than ordinary income. This distinction meaningfully affects after-tax returns, particularly for investors in higher tax brackets.
Megatrend alignment also matters for long-term sustainability. Companies in energy transition and data infrastructure may reinvest heavily rather than distributing profits. In contrast, mature businesses with stable cash flows are structurally better positioned to grow dividends consistently over time.
Related articles for further reading:
What Is Dividend Yield and How Is It Calculated?
What is the difference between dividend yield and payout ratio?
Dividend yield compares the annual dividend to the current share price — a $2.00 annual dividend on a $50 stock produces a 4% yield. Payout ratio compares the dividend to the company’s earnings per share. A 40% payout ratio means the company distributes 40% of its profits. Both metrics matter: yield measures income relative to price, while payout ratio measures sustainability relative to earnings.
Why do stock prices drop on the ex-dividend date?
On the ex-dividend date, the stock price typically falls by approximately the dividend amount. This happens because the company is about to distribute cash to shareholders, reducing its net assets accordingly. The market adjusts the price to reflect the value leaving the company. This drop is mechanical and expected — it does not indicate any deterioration in the underlying business.
Can dividend payments decrease or stop entirely?
Yes. No dividend is legally guaranteed. A company’s board can reduce or eliminate the payment at any time, particularly when earnings fall, debt rises, or the business needs capital for restructuring. Historically, dividend cuts often trigger sharp stock price declines as income-focused investors sell their positions. Monitoring the payout ratio, free cash flow, and earnings revisions helps investors anticipate potential cuts in advance.
This article is for educational purposes only and does not constitute personalized financial or investment advice. All investing involves risk, including the possible loss of principal.