Last updated: July 6, 2026
On October 19, 1987, the Dow Jones Industrial Average fell 22.6% in a single trading day — the largest single-day percentage decline in U.S. market history. No recession had begun. No war had started. Yet a stock crash of that magnitude wiped out nearly a quarter of equity value in one session, driven by a combination of program trading, rising interest rates, and cascading investor fear. Understanding what separates a crash from a correction, what conditions precede one, and how markets have historically recovered removes the paralysis that prevents investors from making rational decisions when prices collapse.
What a Stock Crash Is and How It Differs From a Correction
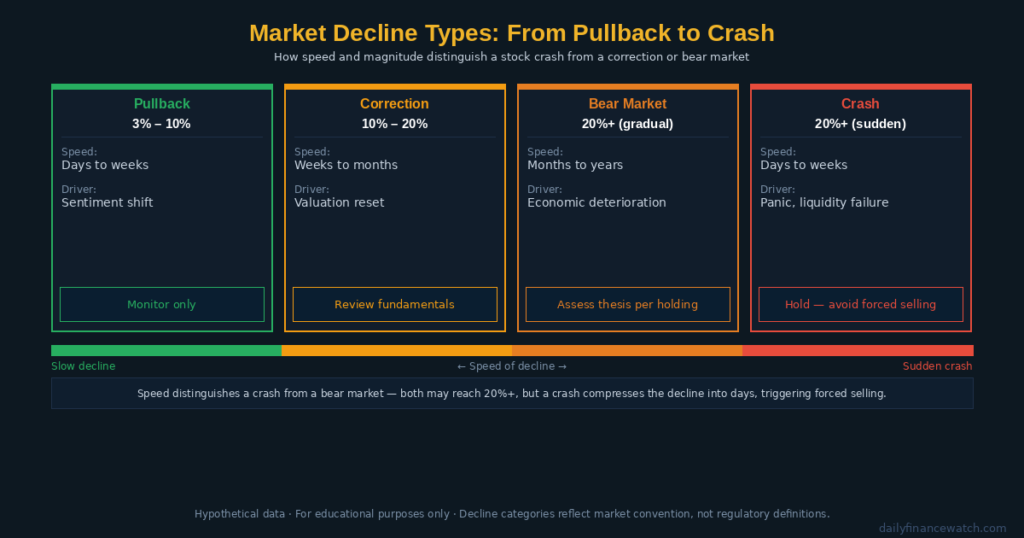
Caption: A stock crash is defined by speed and magnitude together — a sharp, sudden collapse that overwhelms normal market structure.
No universally agreed regulatory definition distinguishes a stock crash from a bear market. However, market professionals consistently use two criteria: a decline of 20% or more occurring over a very short period — days or weeks rather than months — and a speed of decline that overwhelms normal price discovery and liquidity. Corrections decline gradually. Bear markets decline steadily. Crashes collapse suddenly.
| Decline Type | Threshold | Speed | Primary Driver |
|---|---|---|---|
| Pullback | 3%–10% | Days to weeks | Sentiment shift |
| Correction | 10%–20% | Weeks to months | Valuation reset |
| Bear Market | 20%+ | Months to years | Economic deterioration |
| Crash | 20%+ in days or weeks | Days | Panic, liquidity failure, systemic shock |
These categories reflect market convention, not regulatory definitions. Every decline differs in cause and character. According to Investor.gov, the SEC’s official investor education resource, sharp market declines are a historical feature of equity markets and have been followed by recovery in every prior instance — though past recovery does not guarantee future outcomes.
How a Crash Differs From a Bear Market
The critical distinction is velocity. A bear market allows investors weeks or months to reassess positions, adjust allocations, and make deliberate decisions. A crash compresses that process into hours or days. This compression triggers institutional forced selling — margin calls require funds to liquidate holdings regardless of fundamental value — which accelerates the decline beyond what underlying economic conditions alone would justify.
Furthermore, crashes often precede bear markets rather than occur within them. The 1987 crash happened during a period of economic growth. The 2020 COVID crash resolved within weeks and was followed immediately by one of the strongest bull markets in modern history. Therefore, a crash does not automatically mean a prolonged bear market will follow.
What Causes a Stock Market Crash
Crashes share common structural preconditions, even when their immediate triggers differ. A disciplined investor watches these conditions to calibrate risk — not to predict the timing of a crash, which is historically impossible even for professional investors.
Leverage and margin debt amplify declines dramatically. When investors borrow to buy stocks, a price decline forces margin calls — brokers require borrowers to deposit additional capital or sell holdings immediately. Forced selling during a falling market accelerates the decline, which triggers more margin calls, which forces more selling. This feedback loop can drive prices far below fundamental value in a short time.
Valuation extremes reduce the market’s margin for error. When price-to-earnings ratios climb well above historical averages, any negative surprise — an earnings miss, a policy change, or an external shock — triggers a rapid and severe repricing. The higher the starting valuation, the further prices can fall before reaching levels that attract disciplined buyers.
Liquidity failure occurs when sellers overwhelm buyers so completely that normal price discovery breaks down. In October 1987, program trading — automated sell orders triggered by price declines — created a self-reinforcing collapse that the market’s existing structure could not absorb. Circuit breakers, which halt trading when declines exceed certain thresholds, were introduced partly in response to this failure.
External shocks — pandemics, financial system failures, geopolitical events — compress investor decision-making time dramatically. The 2008 financial crisis began with mortgage market deterioration but accelerated into a crash as the interconnection of financial institutions became clear. The S&P 500 fell approximately 57% from peak to trough between October 2007 and March 2009. These figures are cited for educational context and do not predict future outcomes.
Investor Psychology During a Crash
Crashes expose the full force of two behavioral patterns that damage long-term returns. Panic selling — exiting positions rapidly in response to falling prices — converts paper losses into permanent ones and removes the investor from the subsequent recovery. Loss aversion, the behavioral finance concept describing the tendency to experience losses roughly twice as intensely as equivalent gains, makes panic selling feel rational even when historical evidence consistently shows it destroys long-term value.
Herd behavior — the tendency to follow the crowd rather than independent analysis — amplifies crash severity. When institutional investors sell simultaneously, retail investors interpret that selling as evidence that conditions are even worse than they appear. This interpretation drives further selling, further confirming the fear. Recognizing that herd behavior drives crash severity — not necessarily fundamental deterioration — helps investors pause before reacting.
How Major Crashes Have Resolved Historically
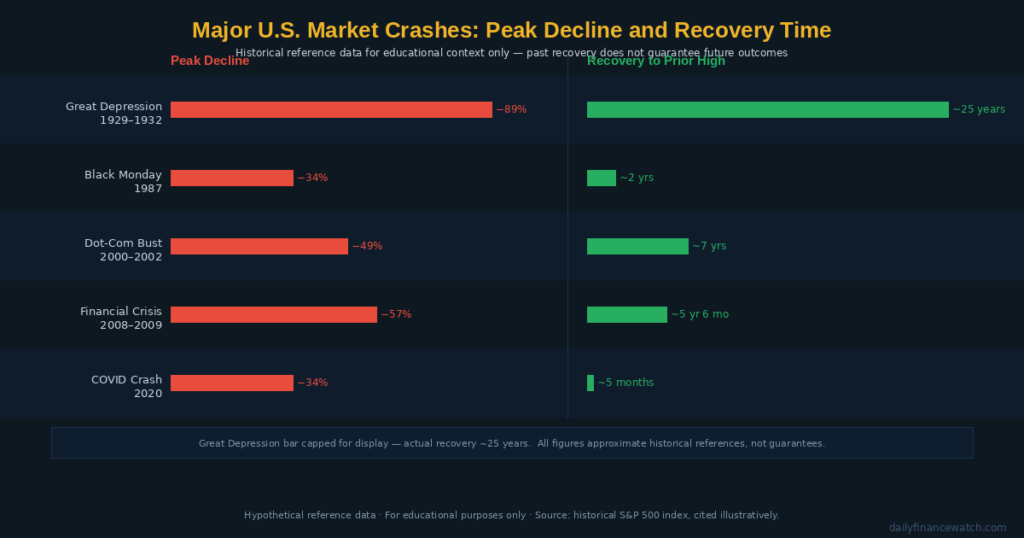
Caption: Every major U.S. market crash since 1929 has been followed by a full recovery — though recovery timelines have varied significantly.
The historical record of U.S. market crashes shows a consistent pattern: every major decline has eventually been followed by a full recovery to prior highs and beyond. However, recovery timelines have varied enormously, and investors who need capital in the near term cannot rely on long-term recovery to protect short-term purchasing power.
| Crash Event | Approximate Peak Decline | Approximate Recovery Time |
|---|---|---|
| Great Depression (1929–1932) | −89% | ~25 years to prior high |
| Black Monday (1987) | −34% | ~2 years |
| Dot-Com Bust (2000–2002) | −49% | ~7 years |
| Financial Crisis (2008–2009) | −57% | ~5.5 years |
| COVID Crash (2020) | −34% | ~5 months |
All figures are approximate historical references cited for educational context only. They do not predict future crash severity or recovery duration. Source: historical S&P 500 index data, cited for illustrative purposes.
The COVID crash recovery stands out for its speed. The S&P 500 fell roughly 34% in 33 days and recovered fully within approximately five months. Moreover, massive fiscal and monetary stimulus — combined with an absence of fundamental earnings deterioration in many large-cap technology companies — accelerated the return to prior highs. This pattern does not mean every crash resolves quickly. The Great Depression crash required roughly 25 years to recover to prior highs, reflecting the severity of the underlying economic damage.
A disciplined investor may use this data not to predict recovery timing, but to calibrate time horizon requirements before committing capital. Investors with a five-year or longer horizon have historically had sufficient time to recover from every prior crash. Investors with a one-to-two-year horizon face genuine sequence-of-returns risk — the risk that a crash occurs precisely when capital is needed.
For context on how crashes relate to broader market cycle phases, see what bull and bear market cycles mean for your returns.
How Disciplined Investors Prepare for and Respond to a Crash
Preparation before a crash matters far more than reaction during one. A disciplined investor builds a framework during calm market periods so that emotional pressure during a crash does not drive decisions.
Maintaining Adequate Liquidity Before a Crash
The single most important pre-crash preparation is holding sufficient cash or cash equivalents outside the investment portfolio to cover near-term financial needs. An investor who needs to sell equities during a crash to fund living expenses becomes a forced seller at the worst possible time. Holding six to twelve months of expenses in cash or short-term instruments eliminates forced selling and allows the investor to hold through the decline.
Reviewing Position Quality, Not Reacting to Price
During a crash, a disciplined investor reviews each holding against the original investment thesis rather than against its current price. The relevant question is not “how much has this fallen?” but “has the reason I own this changed?” A hypothetical investor holding Apple at $180 who watches it fall to $130 during a market-wide crash asks: Is Apple’s revenue still growing? Is its balance sheet still strong? Is its free cash flow still positive? If the answers remain favorable, the decline reflects market-wide fear rather than Apple-specific deterioration. This does not guarantee the stock will recover to any specific price.
Dollar-Cost Averaging Through a Crash
Investors who contribute fixed amounts at regular intervals — regardless of market conditions — automatically purchase more shares during a crash when prices are depressed. A hypothetical investor contributing $500 per month to an S&P 500 index fund like SPY accumulates significantly more units during a crash than during a bull run at the same contribution level. This reduces the average cost per share over time without requiring any prediction of when the crash will end. Dollar-cost averaging does not eliminate risk or guarantee profit, but it removes the pressure of timing individual purchases during volatile periods.
According to FINRA’s investor education materials, investors who maintain consistent long-term strategies through market downturns historically achieve better outcomes than those who make reactive allocation changes during periods of peak fear.
For more on how volatility drives the price swings that precede and follow a crash, see what stock volatility means for your portfolio.
What is the difference between a stock market crash and a correction?
A correction is a decline of 10%–20% that develops over weeks to months. A stock crash is typically a decline of 20% or more that occurs over days to weeks — far faster than a correction. The speed is the defining feature. Crashes overwhelm normal market liquidity and trigger forced institutional selling. Corrections allow investors time to reassess deliberately. Both can precede or follow each other, but they operate on fundamentally different timescales.
Why do stock markets recover after a crash?
Markets recover because the underlying productive capacity of businesses does not disappear during a crash. When prices fall far below fundamental value, disciplined buyers — institutions, value investors, and long-term funds — gradually re-enter the market. Central banks and governments typically respond with stimulus measures that support economic conditions. Additionally, corporate earnings tend to recover as economic activity resumes, which justifies higher equity prices over time. Recovery is not guaranteed in any specific timeframe, and some crashes have taken decades to fully resolve.
How should a beginner investor respond when a stock market crash begins?
A beginner investor’s most productive response is to avoid making any major portfolio changes driven purely by price. Selling during a crash locks in losses and creates the risk of missing the recovery. The right time to review risk tolerance is before a crash — not during one. During the crash itself, the most disciplined actions are confirming that emergency reserves are fully separate from investment accounts, continuing regular contributions if financially able, and reviewing each holding’s fundamentals rather than its current price.
This article is for educational purposes only and does not constitute personalized financial or investment advice. All investing involves risk, including the possible loss of principal.